Friday, December 30, 2011
Coal seam gas map
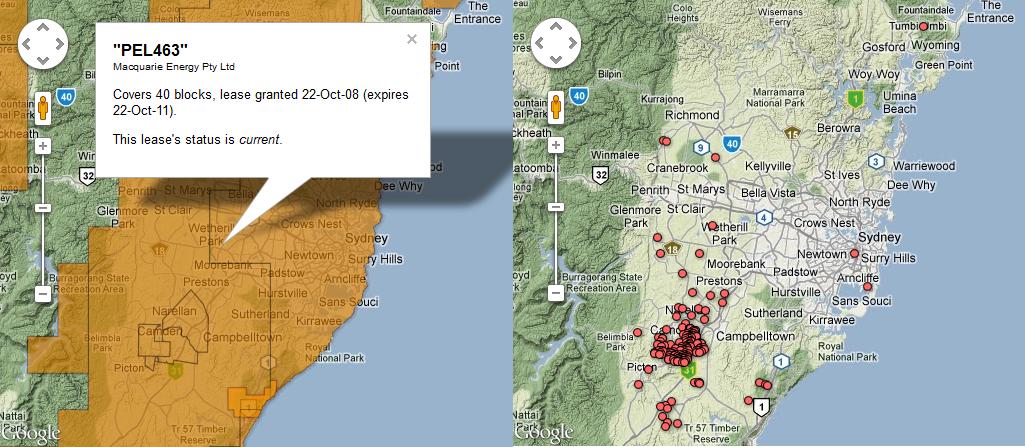
The topic of coal seam gas is very popular in media in recent months due to well publicised protests by farmers and overall uncertainty of the impact of coal seam gas exploration on the environment, and ground water in particular. Australian national broadcaster, ABC created an online, interactive educational guide that explains key issues under debate. It is titled Coal Seam Gas – By The Numbers.
As a part of this resource, ABC published a map containing information about location of wells and exploration leases granted to private companies so users can assess what activity is undertaken in their immediate neighbourhood.
 Interestingly, it is not only rural areas that experience the coal seam gas rush. As reported by ABC, there are more than 100 wells at Camden, 60 kilometres south of Sydney. The NSW Government, unlike Queensland, has not moved to create no-mining buffer zones around urban areas.
Thursday, December 29, 2011
Google Maps: Mapping the indoors
“Where am I?” and “What’s around me?” are two questions that cartographers, and Google Maps, strive to answer. With Google Maps’ “My Location” feature, which shows your location as a blue dot, you can see where you are on the map to avoid walking the wrong direction on city streets, or to get your bearings if you’re hiking an unfamiliar trail. Google Maps also displays additional details, such as places, landmarks and geographical features, to give you context about what’s nearby. And now, Google Maps for Android enables you to figure out where you are and see where you might want to go when you’re indoors.
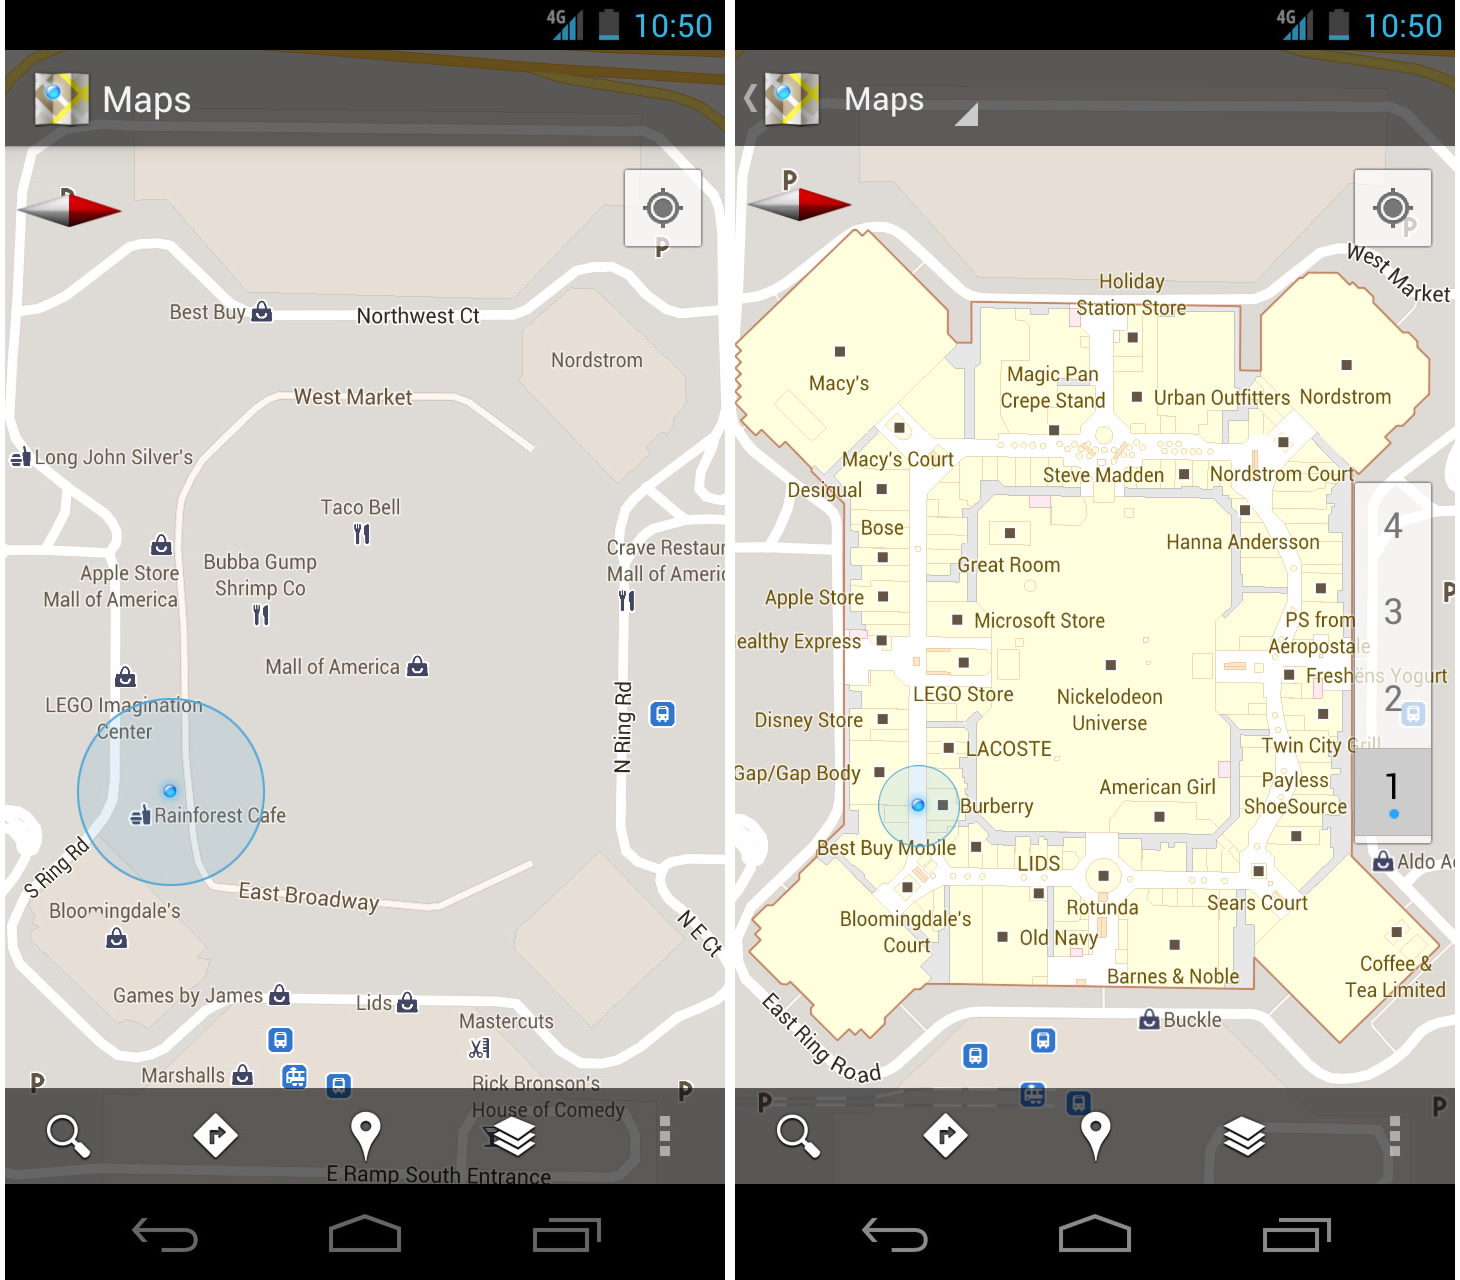
When you’re inside an airport, shopping mall or retail store, a common way to figure out where you are is to look for a freestanding map directory or ask an employee for help. Starting today, with the release of Google Maps 6.0 for Android, that directory is brought to the palm of your hands, helping you determine where you are, what floor you're on, and where to go indoors.
Detailed floor plans automatically appear when you’re viewing the map and zoomed in on a building where indoor map data is available. The familiar “blue dot” icon indicates your location within several meters, and when you move up or down a level in a building with multiple floors, the interface will automatically update to display which floor you’re on. All this is achieved by using an approach similar to that of ‘My Location’ for outdoor spaces, but fine tuned for indoors.
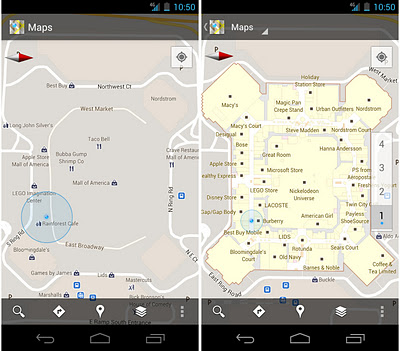 Mall of America in Minneapolis before and after, with a floor selector
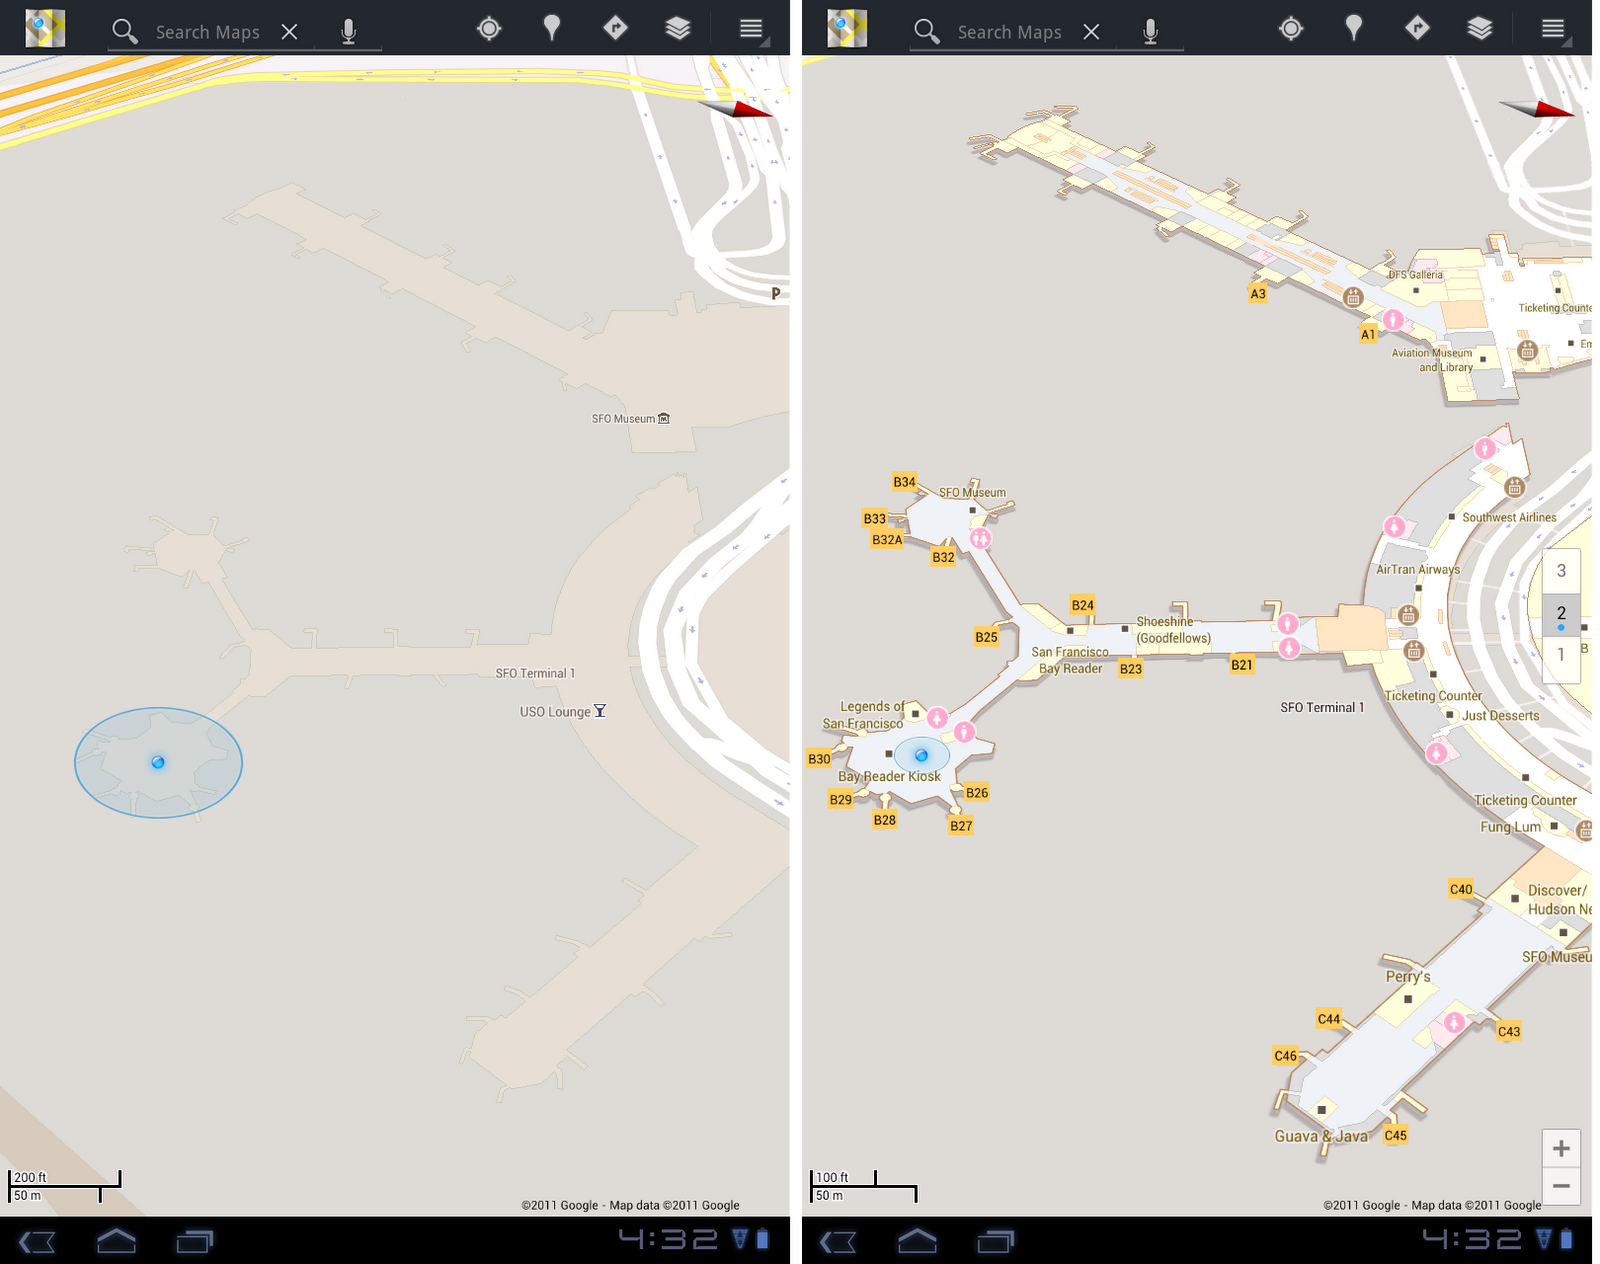
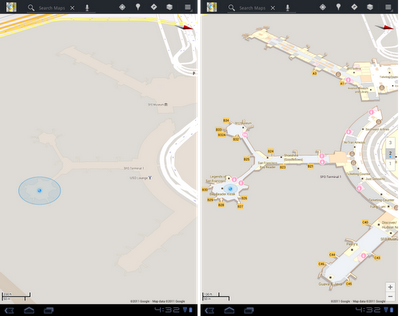 San Francisco International Airport before and after, with 3D tilt
We’ve initially partnered with some of the largest retailers, airports and transit stations in the U.S. and Japan, including:
San Francisco International Airport before and after, with 3D tilt
We’ve initially partnered with some of the largest retailers, airports and transit stations in the U.S. and Japan, including:
 Mall of America in Minneapolis before and after, with a floor selector
 San Francisco International Airport before and after, with 3D tilt
We’ve initially partnered with some of the largest retailers, airports and transit stations in the U.S. and Japan, including:
San Francisco International Airport before and after, with 3D tilt
We’ve initially partnered with some of the largest retailers, airports and transit stations in the U.S. and Japan, including:
- Mall of America, IKEA, The Home Depot, select Macy’s and Bloomingdale’s, Daimaru, Takashimaya and Mitsukoshi locations and more. Watch an IKEA demo here.
- Hartsfield-Jackson Atlanta International Airport (ATL), Chicago O’Hare (ORD), San Francisco International Airport (SFO) and Narita International (NRT), among others.
- JR and Tokyu Corporation
Wednesday, December 28, 2011
Google Places Check-in Offers
The ability to provide a Google check-in offer is now live. The feature has been added to the Offer coupon creation option in the Google Places dashboard and a detailed help file has been added to Places for Business Help area. Google describes the process as follows:
 Discussion:
Coupon offers have had a checkered past within Google Places.This is the first time since the creations of Places Offer coupons that a meaningful way to surface them has been presented. As a check-in offer they don’t really function to drive new traffic and they target customers that are already at your location. As such it makes sense to try them as a way to increase upsells and possibly to promote new services that your customer might not be aware of.
The ability for customers to share them via Google + is interesting but discovery is limited by the fact that they are only visible when a customer visits and are currently can only be seen on Google Maps for Mobile on Android. No iPhone option currently exists that I know of.
Google + is only integrated to the extent that a user can share the coupon with their circles. There is no way to currently to easily promote the coupon via a business + page although it is possible.
The bottom line? Coupons may have a life yet at Google as a way to offer a more granular user shopping experience. This baby step to exposing them helps but not as much as one might hope for.
Discussion:
Coupon offers have had a checkered past within Google Places.This is the first time since the creations of Places Offer coupons that a meaningful way to surface them has been presented. As a check-in offer they don’t really function to drive new traffic and they target customers that are already at your location. As such it makes sense to try them as a way to increase upsells and possibly to promote new services that your customer might not be aware of.
The ability for customers to share them via Google + is interesting but discovery is limited by the fact that they are only visible when a customer visits and are currently can only be seen on Google Maps for Mobile on Android. No iPhone option currently exists that I know of.
Google + is only integrated to the extent that a user can share the coupon with their circles. There is no way to currently to easily promote the coupon via a business + page although it is possible.
The bottom line? Coupons may have a life yet at Google as a way to offer a more granular user shopping experience. This baby step to exposing them helps but not as much as one might hope for.
Allowing customers to check-in when they redeem offers
If your customers have to visit your locations in order to do business with you, you can request that they check-in on Google Maps for Mobile before they redeem your offer. To check in to places, users first sign in to Google+. They can choose to share the check-in publicly or with some of their circles, which helps spread the word about your business within their circles on Google+. They can also choose to keep their check-in private and still redeem an offer.
If your customers do not have to visit your location, for example if you serve homes or businesses by delivery or by callouts, you can keep this option off (set to “No”) and customers will not be asked to check-in when they redeem offers. We use the Service Areas and Location Settings setting on your listing to determine if you have a service area for offers that have already been created. When you create a new offer, you can choose whether to allow a check-in during redemption.
How can check-ins help my business?
Check-ins are a good way to promote your business online. It’s like an online tool for word of mouth advertising. It also associates the use of an offer with your physical location which helps connect customers both online and offline.
How much does it cost to upload an offer into Google Places?
It’s free for merchants to upload an offer into Google Places.
Will other people see my customers’ check-ins to my business?
Your customers will choose who see their check-ins on Google+. If check-ins are public, anyone can see them. If check-ins are shared with a circle, a smaller group such as the family or coworkers will see them. If check-ins are private, only the customer can see them.
If I ask users to check-in when they redeem an offer, do people have to check-in?
Customers who use Google products that support offers and check-ins (currently Google Maps for Mobile on Android) will have to check-in when they redeem an offer. Customers can choose which circles they share their check-in with.
Which products can ask users to check-in?
Currently, Google Maps for Mobile on Android will ask customers to check-in before they use an offer. Other mobile products that have offers (such as the Google Offers for Android) will soon ask users to check-in as well.
The process to create a check-in offer is very simple. Select the Offers tab in the Places dashboard and answer the last question in the affirmative:
Discussion:
Coupon offers have had a checkered past within Google Places.This is the first time since the creations of Places Offer coupons that a meaningful way to surface them has been presented. As a check-in offer they don’t really function to drive new traffic and they target customers that are already at your location. As such it makes sense to try them as a way to increase upsells and possibly to promote new services that your customer might not be aware of.
The ability for customers to share them via Google + is interesting but discovery is limited by the fact that they are only visible when a customer visits and are currently can only be seen on Google Maps for Mobile on Android. No iPhone option currently exists that I know of.
Google + is only integrated to the extent that a user can share the coupon with their circles. There is no way to currently to easily promote the coupon via a business + page although it is possible.
The bottom line? Coupons may have a life yet at Google as a way to offer a more granular user shopping experience. This baby step to exposing them helps but not as much as one might hope for.
Mapping with the New Map Maker
With 2012 approaching, we're getting a head start on our New Year's resolution to shed some excess weight and improve our overall appearance. You may have seen our ongoing efforts to improve the look, feel, and user experience across many other Google products to date. And with Google Map Maker available in the United States, Canada, and more than 180 other regions, it's time for another makeover. Today, we’re revealing a new version of Google Map Maker to help users map the places they know best and make their hometowns sparkle on Google Maps. With Map Maker, you can easily help ensure that the changing world around you is accurately reflected on the map. Add your favorite gift shop, the nearest tree farm, or even the golf course where you once got that hole in one. It’s also easier to mark the best route to Grandma’s house and draw better buildings with courtyards and crisper corners. The options are endless when it comes to mapping the places you know and love. Once approved, your contributions will appear on Google Maps, Google Earth and Google Maps for mobile for all the world to see.
You don’t have to be an expert to start using Google Map Maker. High school student and Eagle Scout Tommy Bruce is a mapping superstar who finds mapping fun, fulfilling, and a simple way to help those in his community have the best, most comprehensive information possible. He started by mapping bike trails in his hometown of Mooresville, North Carolina and is now on an exchange program in Puebla, Mexico, mapping unmarked rivers that run through town! After witnessing Tommy’s accomplishments firsthand at the U.S. Geo User Summit, even his mother Margaret began thinking of places that she’s eager to put on the map.
Saturday, December 24, 2011
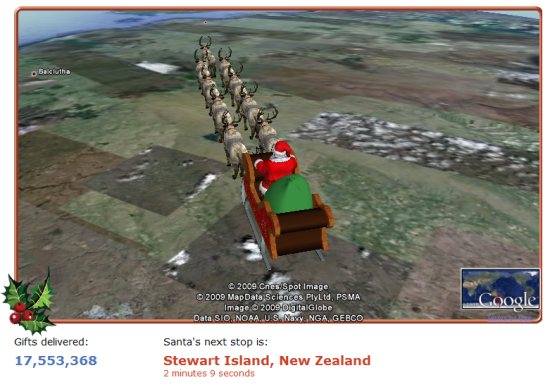
Tracking Santa in Google Earth
Starting around 2am EST tonight, Santa's journey will begin and NORAD will once again be tracking his every move!
His journey will be tracked using a variety of methods including satellites, radar and fighter jets.
 , but read on for other ways to follow his journey throughout the day.
If you missed the chance to watch his journey the past few years, here is a highlight reel that Google has put together:
, but read on for other ways to follow his journey throughout the day.
If you missed the chance to watch his journey the past few years, here is a highlight reel that Google has put together:
, but read on for other ways to follow his journey throughout the day.
If you missed the chance to watch his journey the past few years, here is a highlight reel that Google has put together:
page to watch Santa fly by using the Google Earth Plug-in. The past few years I fired up this page on my netbook, placed it up on the mantle, and we kept a close eye on Santa all day long.
• New this year; follow Santa with OnStar. If you have a GM car with OnStar, you'll be able to push the OnStar button and get an update on Santa's location (more info).
• Follow his progress on your phone. Search for [santa] in Google Maps for Mobile, or visit m.noradsanta.org from your phone to track his progress while you're on the go.
• Follow him on other services, such as his YouTube channel, Twitter account and Facebook Page.
Having NORAD track Santa has been a tradition for decades, and using Google Earth/Maps to track him has quickly become a popular tradition of its own. Millions of people track Santa using these fun new methods, with more joining in every year. Friday, December 23, 2011
Bird's Eye on Five New Cities
 U.S. Space & Rocket Center, Huntsville
Googel has unveiled new aerial view imagery in Detroit, Fayetteville, AR, Nashville-Franklin, TN, Baton Rouge, LA, Huntsville, AL
U.S. Space & Rocket Center, Huntsville
Googel has unveiled new aerial view imagery in Detroit, Fayetteville, AR, Nashville-Franklin, TN, Baton Rouge, LA, Huntsville, AL
 Louisiana State Capitol
Via: GoogleLatLong
Louisiana State Capitol
Via: GoogleLatLongGoogle Apps Script
Google Groups is a great way to foster communication over email and on the web, connecting people and allowing them to participate in and read archived discussions. Today, we are introducing the Google Groups Service in Google Apps Script. Groups Service will allow a script to check if a user belongs to a certain group, or to enumerate the members of a particular group. The Google Groups Service works with groups created through the Google Groups web interface as well as groups created by enterprise customers with their own domain using the control panel and the Google Apps Provisioning API.
This opens a wide range of possibilities, such as allowing a script with Ui Services to show additional buttons to the members of a particular group - for example teachers or managers - and sending customized emails to all the members of a group.
Here are a few sample scripts to help you get started with the new API. To try out these samples, select Create > New Spreadsheet and then Tools > Script Editor from the menu. You can then copy the code into the script editor. The scripts’ output will appear back in the spreadsheet.
List Your Google Groups
The Groups Services can be used to fetch a list of the Google Groups of which you’re a member. Below is a function which returns all the groups of which you’re a member. Copy and paste it into the script editor and run it. The editor will prompt you to grant READ access to the Google Groups Service before the script can run successfully. If you receive a message stating that you’re not a member of any group, open up Google Groups and join any of the thousands of groups there.function showMyGroups() {
var groups = GroupsApp.getGroups();
var s;
if (groups.length > 0) {
s = "You belong to " + groups.length + " groups: ";
for (var i = 0; i < groups.length; i++) { var group = groups[i]; if (i > 0) {
s += ", ";
}
s += group.getEmail();
}
} else {
s = "You are not a member of any group!";
}
Browser.msgBox(s);
}
Test Group Membership
Brendan plays trumpet in a band. He also runs the band’s website and updates its Google+ page. He’s created a web application with Google Apps Script and now he wants to add to it some additional features for members of the band. Being a model Google user, he’s already subscribed each band member to a Google Group. Although building a complete UI with Google Apps Script is beyond the scope of this article, Brendan could adapt the following function to help make additional features available only to members of that Google Group. Of course, this is not just useful for tech-savvy trumpet players: schools may wish to make certain features available just to teachers or others just to students; businesses may need to offer certain functionality to people managers or simply to show on a page or in a UI operations of interest to those in a particular department. Before running this example yourself, replacetest@example.com with the email address of any group of which you’re a member.
Note: the group’s member list must be visible to the user running the script. Generally, this means you must yourself be a member of a group to successfully test if another user is a member of that same group. Additionally, group owners and managers can restrict member list access to group owners and managers. For such groups, you must be an owner or manager of the group to query membership.
function testGroupMembership() {
  var groupEmail = "test@example.com";
  var group = GroupsApp.getGroupByName(groupEmail);
  if (group.hasUser(Session.getActiveUser().getEmail())) {
    Browser.msgBox("You are a member of " + groupEmail);
  } else {
    Browser.msgBox("You are not a member of " + groupEmail);
  }
}
Get a List of Group Members
Sending an email to the group’s email address forwards that message to all the members of the group. Specifically, that message is forwarded to all those members who subscribe by email. Indeed, for many users, discussion over email is the principal feature of Google Groups. Suppose, however, that you want to send a customised message to those same people. Provided you have permission to view a group’s member list, the Google Groups Service can be used to fetch the usernames of all the members of a group. The following script demonstrates how to fetch this list and then send an email to each member. Before running this script, consider if you actually want to send a very silly message to all the members of the group. It may be advisable just to examine how the script works!function sendCustomizedEmail() {
var groupEmail = "test@example.com";
var group = GroupsApp.getGroupByEmail(groupEmail);
var users = group.getUsers();
for (var i = 0; i < users.length; i++) {
var user = users[i];
MailApp.sendEmail(user.getEmail(), "Thank you!",
"Hello " + user.getEmail() + ", thank you for joining this group!");
}
}
Find Group Managers
The Google Groups Service lets you query a user’s role within a group. One possible role is MANAGER (the other roles are described in detail in the Google Groups Service’s documentation): these users can perform administrative tasks on the group, such as renaming the group and accepting membership requests. Any user’s Role can be queried with the help of the Group class’ getRole() method. This sample function may be used to fetch a list of a group’s managers. Once again, you must have access to the group’s member list for this function to run successfully:function getGroupOwners(group) {
var users = group.getUsers();
var managers = [];
for (var i = 0; i < users.length; i++) {
var user = users[i];
if (group.getRole(user) == GroupsApp.Role.MANAGER) {
managers.push(user);
}
}
return managers;
}
Thursday, December 22, 2011
The Ovi Maps goes WebGL
Earlier this year we showed you the new Ovi Maps 3D, a rather nice 3D globe. It certainly wasn't close to Google Earth in terms of features or depth, but it had some pretty cool 3D features in a few cities.
Not much has changed with it, aside from one big thing -- they now have a WebGL version. Similar the Google Maps WebGL version that came out last week, you can now view the full Ovi Maps 3D experience in your browser without having to load a plugin. It only works in Chrome right now, but other browsers are being tested.
 While it's certainly not close to being as comprehensive as Google Earth, it has us even more excited for the future of WebGL. Google Maps brought us a few 3D buildings in its WebGL version last week (including nice touches like shadows), and now Ovi Maps 3D is showing us a WebGL map that feels a lot more like Google Earth.
Having over a billion downloads of Google Earth means that the Google Earth plug-in is already installed on hundreds of millions of computers. However, being able to access it from the browser without having to use a plug-in at all would be awesome.
Google hasn't said anything about porting Google Earth to WebGL, but I'm sure it's something they're at least considering. Part of that would likely include the ability to sync "My Places" to the cloud, something I've desired for a while. Imagine accessing Google Earth from any web browser and having your full list of Places available at your fingertips. The prospects are quite intriguing, so I'm excited to see what the future might hold!
Try it for yourself at maps.nokia.com/webgl.
While it's certainly not close to being as comprehensive as Google Earth, it has us even more excited for the future of WebGL. Google Maps brought us a few 3D buildings in its WebGL version last week (including nice touches like shadows), and now Ovi Maps 3D is showing us a WebGL map that feels a lot more like Google Earth.
Having over a billion downloads of Google Earth means that the Google Earth plug-in is already installed on hundreds of millions of computers. However, being able to access it from the browser without having to use a plug-in at all would be awesome.
Google hasn't said anything about porting Google Earth to WebGL, but I'm sure it's something they're at least considering. Part of that would likely include the ability to sync "My Places" to the cloud, something I've desired for a while. Imagine accessing Google Earth from any web browser and having your full list of Places available at your fingertips. The prospects are quite intriguing, so I'm excited to see what the future might hold!
Try it for yourself at maps.nokia.com/webgl.
The usage limits to the Google Maps API
When the Maps API Terms of Service were updated in April of this year Google announced that usage limits would be introduced to the Maps API starting on October 1st. With October upon us, I’d like to provide an update on how these limits are being introduced, and the impact it will have on your Maps API sites.
The usage limits that now apply to Maps API sites are documented in the Maps API FAQ. However no site exceeding these limits will stop working immediately. We understand that developers need time to evaluate their usage, determine if they are affected, and respond if necessary. There are three options available for sites that are exceeding the limits:
- Reduce your usage to below the limits
- Opt-in to paying for your excess usage at the rates given in the FAQ
- Purchase a Maps API Premier license
Thursday, December 15, 2011
SketchUp: PULSE
Odds are, you’ve encountered Harald Belker’s work before. As a leading Hollywood concept artist, Harald is the man behind several iconic movie vehicles. His vehicular creds include:
The Batmobile from Batman & Robin
The Lightcycle from TRON: Legacy
The Lexus 2054 and Mag-Lev vehicles from Spielberg’s classic, Minority Report
The guy's got serious game.
So you can imagine our delight when our friends at Filter Foundry told us that Harald was using SketchUp extensively on his latest project, PULSE: the complete guide to the future of racing. We immediately reached out to Harald who happily agreed to tell us more.
“I can somehow just create in SketchUp,” Harald explains. “It allows me to visualize my ideas very quickly, giving me free range to explore. I literally use SketchUp the way I used to sketch with a pencil.”
 Harald starts with a SketchUp model and uses Photoshop to bring it to life.
He continues, “SketchUp allows me to very easily create an environment for any vehicle I have designed. The typical application for SketchUp is to model something in 3D, set up the perspective, export the image and use that as an underlay for an illustration in Photoshop.”
Harald starts with a SketchUp model and uses Photoshop to bring it to life.
He continues, “SketchUp allows me to very easily create an environment for any vehicle I have designed. The typical application for SketchUp is to model something in 3D, set up the perspective, export the image and use that as an underlay for an illustration in Photoshop.”
 This evolution of a space through SketchUp and Photoshop.
Speaking more broadly about SketchUp’s role in the movie industry, Harald tell us that “once it caught on, it spread like wildfire. Now everybody I know is using it.”
He continues, “Since a lot of people I work with are using SketchUp, it’s a great crossover platform, too. I can model something in SketchUp and I can send that file to somebody who adds something else to it, and it sort of becomes this thing that everybody adds to.”
This evolution of a space through SketchUp and Photoshop.
Speaking more broadly about SketchUp’s role in the movie industry, Harald tell us that “once it caught on, it spread like wildfire. Now everybody I know is using it.”
He continues, “Since a lot of people I work with are using SketchUp, it’s a great crossover platform, too. I can model something in SketchUp and I can send that file to somebody who adds something else to it, and it sort of becomes this thing that everybody adds to.”
 An electric race from the pages of PULSE.
Thankfully, Harald believes it’s the “natural obligation” of an industry vet to share acquired knowledge, and to make good, he’s posting a series of SketchUp quick tips on Filter Foundry. His first tip shows “how easy it is to create good tires in SketchUp.” Stay tuned for more.
An electric race from the pages of PULSE.
Thankfully, Harald believes it’s the “natural obligation” of an industry vet to share acquired knowledge, and to make good, he’s posting a series of SketchUp quick tips on Filter Foundry. His first tip shows “how easy it is to create good tires in SketchUp.” Stay tuned for more.
 Harald is offering SketchUp tips on Filter Foundry.
As a final note, it’s worth mentioning that Harald got into SketchUp the way most of us did: by modeling (or at least attempting to model) his own house.
Harald is offering SketchUp tips on Filter Foundry.
As a final note, it’s worth mentioning that Harald got into SketchUp the way most of us did: by modeling (or at least attempting to model) his own house.
 Like most, Harald first used SketchUp to design his house.
“The way I learned SketchUp was on a tip from a friend, who said to just make your own house in SketchUp.” With a big grin, Harald continues, “Before I was even close to finishing my own house, I started designing my dream house. It ended up being 15,000 square feet. It’s a little big, but there’s nothing wrong with dreaming big.”
Like most, Harald first used SketchUp to design his house.
“The way I learned SketchUp was on a tip from a friend, who said to just make your own house in SketchUp.” With a big grin, Harald continues, “Before I was even close to finishing my own house, I started designing my dream house. It ended up being 15,000 square feet. It’s a little big, but there’s nothing wrong with dreaming big.”
The New Google APIs Console
It's been nearly one year since we launched the Google APIs Console to help you manage API usage across your sites and apps. We've had some great feedback about what you like (and don't), and are working hard every day to improve the overall experience. To this end, we want to highlight a number of recent enhancements.
Introducing v2 of the Google APIs Console Traffic Reports Page
The Google APIs Console contains a list of traffic reports that display information about how the APIs enabled per project are being used. Based on customer feedback, we've made a few enhancements:
We believe we have made the Traffic Reports page cleaner and more compact without losing any functionality. We already have a list of enhancements we want to make to the page, and we would love to hear from you to help drive our prioritization.
Introducing the Google APIs Console Dashboard
You told us that you want to jump into a project's page and see more of a dashboard that describes what's happening on your project. You said you want to see which services are enabled, the availability of said services, general project administration, and a quick link to how much the project costs to run.
Our new Dashboard page is the first step in delivering on this experience. We will continue to enhance the Dashboard based on your collective feedback, so please take a look and let us know what you think.
New APIs Available in the Google APIs Console
We'd also like to announce some APIs are now available in the Console:
Web Fonts Developer API: this gives access to the metadata available for all families served by Google Web Fonts. You can create dynamic apps that can query Google Web Fonts and get an accurate list of the families currently available.
Google Orkut v2 REST API: this enables you to access select Orkut features. This API works like an extension of the JSON-RPC off-site application API, although it uses a different protocol.
Google Analytics Management API v3: this provides read-only access to Google Analytics configuration data. With the Management API you can list all the Account, Web Property and Profile information for a user, retrieve a Profile ID to use with the Data Export API, determine which goals are active and access their configured names, and retrieve a user's Custom Segments to apply them to Data Export API queries.
Blogger JSON API: this allows client applications to view and update Blogger content in the form of Google Data API feeds. Your client application can use the Blogger Data API to create new blog posts, edit and delete existing blog posts, and query for blog posts that match particular criteria.
- We have consolidated all API traffic in a single display.
- We now compare traffic between multiple APIs in a single project.
- We now show demographic and usage data about your API requests.
 |
| New traffic reports page |
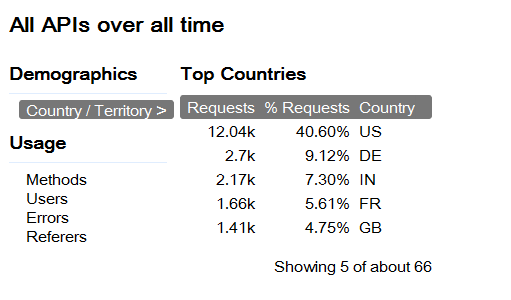 |
| Demographic data is available from traffic reports |
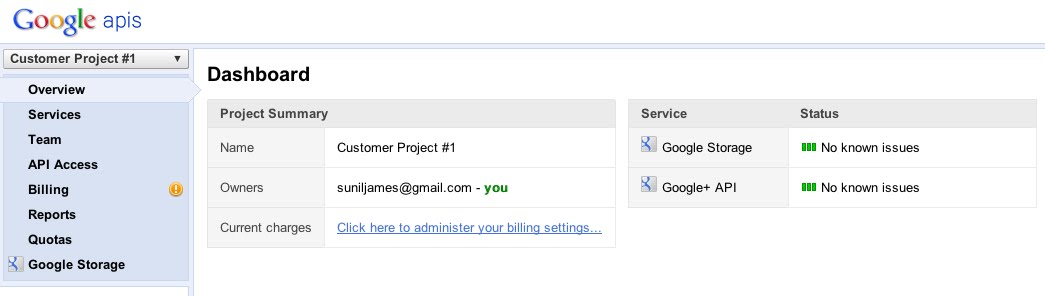 |
| New APIs Console Dashboard |
Wednesday, December 14, 2011
SketchUp: Trelligence Affinity
Some architects begin new projects by creating a “bubble diagram” that turns the program — the list of space requirements for a building—into a set of shapes. Mostly, these diagrams are useful for figuring out adjacencies and loose spatial relationships. They’re really about translating information in spreadsheets into something that can begin to inform decisions about space, form, structure and all the other good stuff that makes buildings worth building.
Over time, we’ve seen an awful lot of architects use SketchUp Pro as a tool for making more-accurate bubble diagrams. They create “rooms” whose areas match the ones in the program, group each one, and arrange them three-dimensionally. The results aren’t buildings, per se—I prefer to call them shoebox models. They can be very useful, but there’s a catch: once a room changes size, there’s a disconnect between the spreadsheet (which is what the client is asking for) and the nascent design.
That’s where the SketchUp interoperability in Trelligence Affinity comes in. Affinity is Windows software made specifically for the architectural programming and schematic design phases. It includes neat tools for visualizing program information in different ways and using that information to guide your design. The new Affinity plug-in for SketchUp lets you easily connect your shoebox model to Affinity, creating a permanent connection between the model, the spreadsheet and all the underlying data about the building requirements. Forgot to include a conference room? Inadvertently doubled the size of the cafeteria? Affinity will let you know. The workflow is actually bi-directional; you can begin in either SketchUp or Affinity.
 You can start with a programmatic massing model in SketchUp. I like to think of these as 'shoebox models'.
 Scanning your model with the Affinity plugin assigns it useful metadata.
 In Affinity, you can view the scanned SketchUp model in different ways.
 The architectural program in Affinity can be linked to your SketchUp model.
You can start with a programmatic massing model in SketchUp. I like to think of these as 'shoebox models'.Scanning your model with the Affinity plugin assigns it useful metadata.In Affinity, you can view the scanned SketchUp model in different ways.The architectural program in Affinity can be linked to your SketchUp model.Friday, December 9, 2011
Participating in the Google Summer of Code


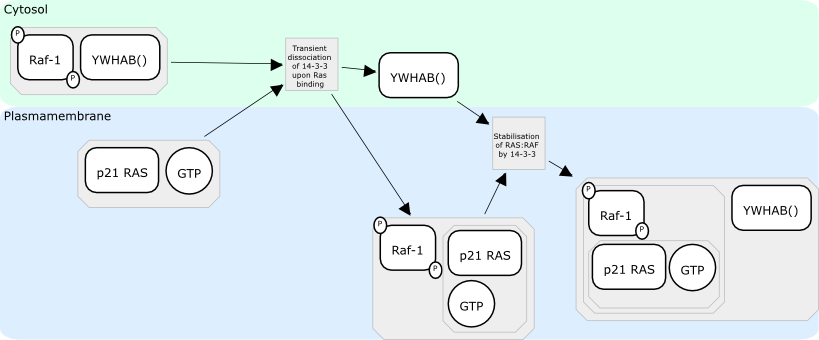
We were very excited about participating in the Google Summer of Code this year for the first time. We, the Theoretical Biophysics Groups at the Humboldt University Berlin, pursue scientific research in the field of Systems Biology by the means of computational models. Our focus is on developing techniques and tools incorporating both new and well established knowledge in order to get a better understanding of the fundamentals of life. In particular, we focus on biological processes in Yeast, Bacillus subtilis, and mammalian cells. Our goal has been to develop a web tool that produces an optimized layout for biological reaction networks.
We were overwhelmed by a large number of extraordinary applications from all over the world and had a difficult time in choosing only three students to mentor for the summer, but we were very excited with our choices. Ben Ripkins created a javascript component which can visualize biological networks dynamically in the browser, Matthias Bock created a server component which retrieves biological networks from public databases, and Wei Jing dealt with the graph layout that determines where the network nodes should be located in the final visualization. We were really surprised how far our students were able to carry their projects given the complexity of the tasks. The results of the student’s work went into the biographer project. We have set up two showcases which demonstrate the interplay of the different student projects. At http://cheetah.biologie.hu-berlin.de/networkexplorer a large network compiled from the public databases Reactome and PID can be walked through and by simply clicking on the next node, the view will refocus thereby uncovering further parts of the network. At http://biographer.biologie.hu-berlin.de networks edited from scratch or loaded from several resources are visualized.
To sum it all up, this year's Google Summer of Code was a great success for all of us and we hope to be involved in future editions of the program.
Wednesday, December 7, 2011
Google Places & UGC
Two weeks ago there were numerous reports of new pop-ups on the Places page to ascertain from visitors the accuracy of a business location, the website associated with the listing, and the quality of included photos. Shortly there after it became obvious that Google was starting to once again actively allowing users to edit every Places attribute of claimed & unclaimed listings via community edit feature.
 Over the weekend I spotted additional pop ups soliciting user input as to hours and the url of websites that are unknown.
After retreating from UGC somewhat in 2010, Google seems to have once again moved very actively and aggressively to permit and encourage user inputs as to the veracity of records.
Over the weekend I spotted additional pop ups soliciting user input as to hours and the url of websites that are unknown.
After retreating from UGC somewhat in 2010, Google seems to have once again moved very actively and aggressively to permit and encourage user inputs as to the veracity of records.
Tuesday, December 6, 2011
The Cloud with Google Apps Script
Sometimes you want to cache data in your script. For example, there’s a RSS feed you want to use and a
UiApp that you’ve built to view and process the feed. Up until now, each operation to work on the feed would require re-fetching the feed, which can get slow.
Enter the newly launched CacheService which will allow for caching resources between script executions. Like the recently announced LockService, there are two kinds of caches: a public cache that is per-script, and a private cache which is per-user, per-script. The private cache should be used to store user-specific data, while the public cache is used to store strings that should be accessible no matter who calls the script.
So for our example feed viewer/processor, you’d already have a function to retrieve and process the feed. In order to use the CacheService, you’d wrap it like this:
function getFeed() {
  var cache = CacheService.getPublicCache();
  var value = cache.get(“my rss feed”);
  if (value == null) {
    // code to fetch the contents of the feed and store it in value
    // here (assumes value is a string)

    // cache will be good for around 3600 seconds (1 hour)
    cache.put(“my rss feed”, value, 3600);
  }
  return value;
}
The cache doesn’t guarantee that you won’t have to fetch it again sooner, but will make a best effort to retain it for that long, and expire it quickly after the time passes. Now you can call getFeed() often and it won’t re-fetch the feed from the remote site on each script execution, resulting in improved performance.
Monday, December 5, 2011
The National Memorial in 3D
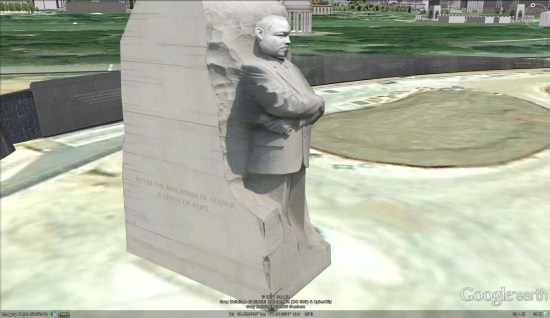
Not long after recreating the Stone Mountain sculpture in 3D, Peter Olsen decided to tackle the brand new Martin Luther King National Memorial, located in the National Mall in Washington, D.C. As you can see below, his model is amazingly detailed. Not only is the figure of MLK curved and detailed, but the text on the side of the statue is very clear and readable.
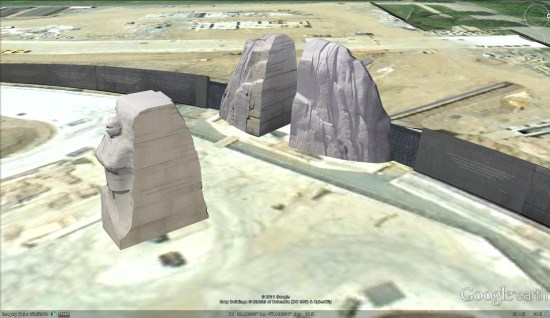
However, just like his Stone Mountain model, he found that it was difficult to piece together because some things simply weren't adding up.
 In his words:
In his words:
When you read the literature on the "creation" of the monument, the sculpture consists of a "mountain" (The Mountain of Despair) from which a "stone" (the Stone of Hope) has been pushed. (See the write-up on the official web site) There is also an animation somewhere that I came across that shows the stone centre being pushed out from the middle of the mountain. So based on that I built the central stone first, as per the above, and was then going to clone the central faces of the mountain from the sides of the stone. There is just one slight problem. Based on numerous photos if have studied, if you take the stone and push it back into the slot in the mountain it does not line up with the cutaway sides of the mountain.The average person would never notice this anomaly. However, Peter takes great pride in building incredibly accurate models and little missteps like this can be frustrating. In any case, he did an amazing job with the models. As you can see, he built all three sections of the memorial -- the mountain, the model of MLK, and the memorial wall.
Google Map Maker for Canada
Google Map Maker is open for users to add their expert local knowledge directly to Google Maps. Users know their neighborhood or hometown best, and with Google Map Maker they can ensure the places they care about are richly represented on the map.
Users can help make the map complete in many ways such as marking hiking paths and trails, fixing the name of a local business, or adding the buildings of a college campus so they appear in Google Maps. We’ve seen incredibly detailed contributions from users worldwide, for example, take a look at the map of a shopping mall in California before and after Map Maker was launched. We’re eager to see the same level of detail for locations throughout Canada.
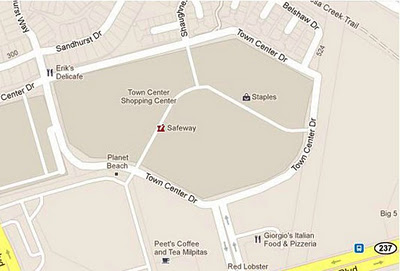
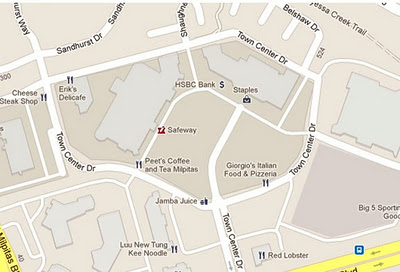
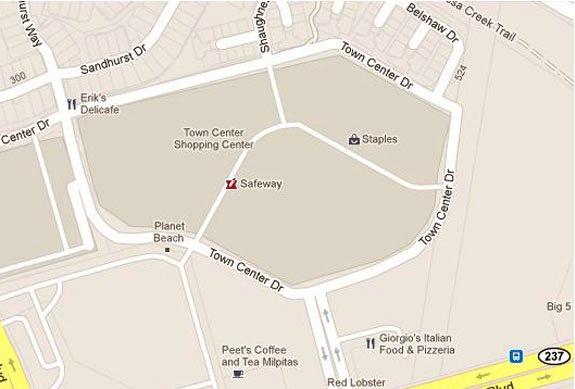
Milpitas, CA (before, avant)

Milpitas, CA (after, après)
To confirm Map Maker user contributions are accurate, each edit will be reviewed. After approval, the edits will appear in Google Maps within minutes. To see examples of what people all around the world are adding in Map Maker, you can watch mapping in real-time.
Citizen cartographers using Google Map Makerin more than 180 other regions of the world help keep maps of their areas accurate and up to date. We are delighted to welcome Canada to the Map Maker family. To learn more, visit our handy guide to mapping Map Makerpedia or check out a video tutorial. Get started mapping at www.google.ca/mapmaker.
Note: Translated to French below.
Posted by James Kelly, Product Manager, Google Map Maker
Ajoutez de la couleur locale à la carte avec l’édition canadienne de Google Map Maker
Aujourd’hui, nous ouvrons la carte du Canada dans Google Map Maker afin que les utilisateurs puissent ajouter directement leurs propres connaissances locales aux cartes Google. Les utilisateurs connaissent leur quartier ou leur ville mieux que quiconque, et grâce à Google Map Maker, ils peuvent s’assurer que leurs endroits préférés figurent sur la carte.
Les utilisateurs peuvent contribuer à enrichir la carte de nombreuses façons, notamment en indiquant les pistes cyclables et les sentiers, en identifiant les commerces locaux, ou en ajoutant les édifices d’un campus universitaire afin qu’ils apparaissent dans Google Maps. Nous avons vu des contributions incroyablement détaillés de la part d'utilisateurs du monde entier. Par exemple, jetez un coup d'oeil à la carte d'un centre commercial en Californie, avant et après le lancement de Map Maker. Nous avons hâte de voir le même souci du détail pour des emplacements situés à travers le Canada.
Afin de confirmer l’exactitude des contributions des utilisateurs de Map Maker, chaque ajout sera révisé. Après approbation, les changements apparaîtront sur Google Maps en quelques minutes. Pour avoir un aperçu de ce que les gens à travers le monde ajoutent à Map Maker, vous pouvez visionner la cartographie en temps réel.
Les citoyens cartographes utilisant Google Map Maker dans plus de 180 autres régions du monde contribuent à rendre les cartes de leur région les plus précises et à jour possible. Nous sommes ravis d’accueillir le Canada dans la famille de Map Maker. Pour vous familiariser avec cet outil, consultez notre guide pratique de cartographie Map Makerpedia ou visionnez notre vidéo pédagogique. Ne perdez pas une minute. Rendez-vous à www.google.ca/mapmaker.
Follow Your World: Support for 43 more languages
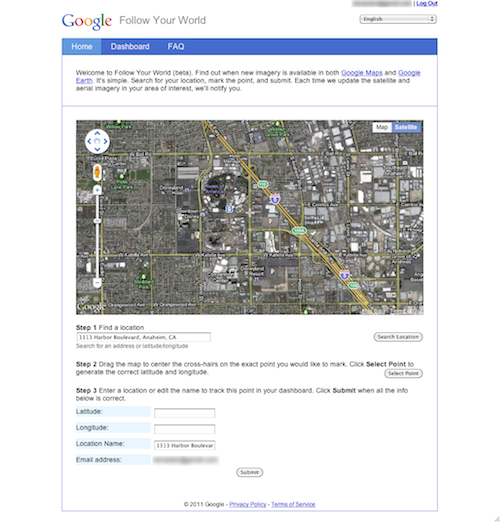
Satellite images make the world seem smaller by letting us view images of buildings and neighborhoods that are thousands of miles away. The satellite views in Google Earth and Google Maps are updated periodically. Want to know when that happens? This week we added support for 43 more languages to Follow Your World, a web site that emails you when satellite images are updated for anywhere you like. Just enter a location and your email address, and you’ll be notified when a new aerial image is available.
 Back on earth, engineers at UC Berkeley’s Biomimetic Millisystems Lab have an awesome job: they get to build little robot bugs. Recently, the team added wings to its 10-centimeter Dynamic Autonomous Sprawled Hexapod (DASH) robot to see how the alteration would affect mobility. The plastic wings helped DASH move faster and climb steeper hills, among other improvements.
Finally, here’s a tiny new feature: if you do a Google search for ip, you’ll see your computer’s IP address. Handy!
And also: check out today’s Google Doodle, which honors the birthday of Mary Blair, a Disney Legend known for her work on It’s a Small World and many other theme park and movie projects.
Back on earth, engineers at UC Berkeley’s Biomimetic Millisystems Lab have an awesome job: they get to build little robot bugs. Recently, the team added wings to its 10-centimeter Dynamic Autonomous Sprawled Hexapod (DASH) robot to see how the alteration would affect mobility. The plastic wings helped DASH move faster and climb steeper hills, among other improvements.
Finally, here’s a tiny new feature: if you do a Google search for ip, you’ll see your computer’s IP address. Handy!
And also: check out today’s Google Doodle, which honors the birthday of Mary Blair, a Disney Legend known for her work on It’s a Small World and many other theme park and movie projects.
Saturday, December 3, 2011
Migrating to v4.3.1 of AdMob SDK for Android
We’ve seen a lot of forum activity about how to migrate from v4.1.1 to v4.3.1 of the Google AdMob Ads SDK for Android, so we’d like to share three easy steps to get you up and running with the latest version.
- The first step to migrating is downloading the AdMob SDK and adding it to your build path.
- You will need to have an Android SDK of 3.2 or higher. Once you have a compatible version, set
target=android-13or higher in yourproject.propertiesfile of your application to compile against the version you just downloaded. Don’t worry, you can still build your apps on all Android devices down to Android 1.5! Just setin yourAndroidManifest.xmlfile. You can read more about the uses-sdk element to help you configure the appropriate devices for your app. - Finally, replace the old
com.google.ads.AdActivityelement in your manifest with this new definition:android:configChanges="keyboard|keyboardHidden|orientation|screenLayout|uiMode|screenSize|smallestScreenSize"/>
Tuesday, November 29, 2011
The Offers tab in Google Wallet
We’re hearing from people at check-out counters throughout the country that paying with your phone is a little like magic. Just look at the ecstatic reaction on the faces of our friends who made their first Google Wallet purchases last Thursday.
Today, our partners American Eagle Outfitters, The Container Store, Foot Locker, Guess, Jamba Juice, Macy’s, OfficeMax and Toys“R”Us are rolling out an even better Google Wallet experience. For the first time ever in the U.S., at these select stores, you can not only pay but also redeem coupons and/or earn rewards points—all with a single tap of your phone. This is what we call the Google Wallet SingleTap experience.
With Google Wallet in hand, you can walk into a Jamba Juice, American Eagle Outfitters or any other partner store. Once you’ve ordered that Razzmatazz smoothie or found the right color Slim Jean, head straight to the cashier and tap your phone to pay and save—that’s it. You don’t have to shuffle around to find the right coupon to scan or rewards card to stamp because it all happens in the blink of an eye.
The Offers tab in Google Wallet has been updated to include a new "Featured Offers" section with discounts that are exclusive to Google Wallet. Today, these include 15% off at American Eagle Outfitters, 10% off at The Container Store, 15% off at Macy’s and an all-fruit smoothie for $2 at Jamba Juice. There are many more Google Wallet exclusive discounts to come, and you can save your favorites in Google Wallet so they’ll be automatically applied to your bill when you check out.
 Organizing loyalty cards in your wallet is getting easier too. Today, Foot Locker, Guess, OfficeMax and American Eagle Outfitters are providing loyalty cards for Google Wallet so you can rack up reward points automatically as you shop. More of these are on the way.
One more thing—in response to user feedback, we’ve improved transaction details for the Google Prepaid Card with real-time transaction information including merchant name, location, dollar value and time of each transaction. Here’s what it looks like:
Organizing loyalty cards in your wallet is getting easier too. Today, Foot Locker, Guess, OfficeMax and American Eagle Outfitters are providing loyalty cards for Google Wallet so you can rack up reward points automatically as you shop. More of these are on the way.
One more thing—in response to user feedback, we’ve improved transaction details for the Google Prepaid Card with real-time transaction information including merchant name, location, dollar value and time of each transaction. Here’s what it looks like:
 Finally, a special thanks to Chevron, D’Agostino, Faber News Now, Gristedes Supermarkets and Pinkberry who are now also working to equip their stores to accept Google Wallet.
It’s still early days for Google Wallet, but this is an important step in expanding the ecosystem of participating merchants to make shopping faster and easier in more places. If you’re a merchant and want to work with us to make shopping easier for your customers and connect with them in new ways, please sign up on the Google Wallet site. And if you’re a shopper and want to purchase a Nexus S 4G phone from Sprint with Google Wallet, visit this page.
Cross-posted on the Official Google Blog
Finally, a special thanks to Chevron, D’Agostino, Faber News Now, Gristedes Supermarkets and Pinkberry who are now also working to equip their stores to accept Google Wallet.
It’s still early days for Google Wallet, but this is an important step in expanding the ecosystem of participating merchants to make shopping faster and easier in more places. If you’re a merchant and want to work with us to make shopping easier for your customers and connect with them in new ways, please sign up on the Google Wallet site. And if you’re a shopper and want to purchase a Nexus S 4G phone from Sprint with Google Wallet, visit this page.
Cross-posted on the Official Google Blog


Monday, November 28, 2011
Google Starting to Integrate Google Plus Pages with Places
The ever observant Plamen and his friend Stacy sent along a Places Search screenshot that clearly shows a Google Plus Page icon next to a Places search result:
When you click on the icon it shows a Google Plus Page for a different Transmission service.
It makes sense that Google would integrate Google Plus pages with their Local results. What better way to both allow a business to highlight the Page’s presence and incent other businesses to claim their Google Plus Page and keep it updated with meaningful information.
I assume that this is test but it is an interesting one.
(click to view larger)
————————
 ————————
Here is the syntax of the url:
http://www.google.com/search?q=transmission+servicing+lexington+ky&hl=en&safe=off
&client=safari&rls=en&prmd=imvns&source=lnms&tbm=plcs
&ei=-PbMTtWiDeXK0AHni8D6Dw
&sa=X&oi=mode_link&ct=mode&cd=8&ved=0CF0Q_AUoBw&prmdo=1
&bav=on.2,or.r_gc.r_pw.r_cp.,cf.osb&biw=1435&bih=721
&emsg=NCSR&noj=1&ei=CvnMTrGUH4Pz0gGZ5DQ
————————
Here is the syntax of the url:
http://www.google.com/search?q=transmission+servicing+lexington+ky&hl=en&safe=off
&client=safari&rls=en&prmd=imvns&source=lnms&tbm=plcs
&ei=-PbMTtWiDeXK0AHni8D6Dw
&sa=X&oi=mode_link&ct=mode&cd=8&ved=0CF0Q_AUoBw&prmdo=1
&bav=on.2,or.r_gc.r_pw.r_cp.,cf.osb&biw=1435&bih=721
&emsg=NCSR&noj=1&ei=CvnMTrGUH4Pz0gGZ5DQ
Examples Of Google Plus Integrated Into Local Search
Several additional instances of Google Plus integration into local search results have been found by Renan Cesar, a Brazilian search marketer. It has also been brought to my attention by Sebastian Socha that examples are now visible in Germany.
In both of these examples, the images, when clicked, go to an intermediate search result highlighting the appropriate Plus Page with an option to add them to your circle. In the first instance the intermediary result shows a recent post. In both cases the Plus page is correctly identified. The intermediate results page that you are taken to offers a somewhat awkward, beta like experience as it is neither a Plus page or a true search result.
At this point, Plus results for local are only showing in the Places Search, one click away from the main search results and thus less visible then they might be. If these results were to show in the main results, the opportunity to enhance a business listing with a large, juicy logo or image would be irresistible. As it is, this current rollout might convince some additional businesses to try Plus. It certainly seems to be pointing to much more visible exposure of Plus Business Pages.
My recommendation? Claim your Business Place Page to avoid squatting (which is all too easy at the moment), associate it with your website and minimally add a few compelling logos and photos.
On this Places Search example for Cake Box New Jersey you see a correctly integrated profile photo on all of their results from the business’s Google Plus page. The image clicks thru to an intermediary search result of a recent post on their Plus Page:
 In second example the Plus page for Manta has been integrated into the organic section of Places search for NEC Store Manhattan.

In second example the Plus page for Manta has been integrated into the organic section of Places search for NEC Store Manhattan.
Friday, November 25, 2011
Google Maps and the green route
We’ve learned that most people who use Google Maps just want to get from Point A to Point B -- as quickly and painlessly as possible. Whether it’s planning a weekend bike route, finding the quickest roads during rush hour, or identifying bus paths with the fewest transfers, people are making the most out of Maps features to travel faster and greener. Here’s how you can use Google Maps to minimize your impact on the environment.
Commuting by bike
As an avid cyclist, I feel very fortunate to live in Boulder, Colorado and be surrounded by over 300 miles of bike lanes, routes and paths. When the weather is cooperating, I try to commute to work every day. It’s a great way to stay healthy and arrive at the office feeling awake! According to Biking Directions in Google Maps, it takes me 10 minutes to travel 2 miles from Point A (my house) to Point B (the office). It also shows three alternative routes, and I can check the weather in Google Maps to see if I’ll need a rain jacket for the ride home. I can also use Biking Directions on my mobile phone, which came in handy for me during a biking trip in Austin when I got lost on a major highway and needed a safe route back to the hotel.
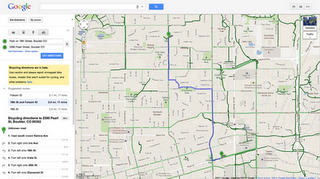
Did you know that Google Maps has biking directions available in over 200 US cities and in 9 Canadian regions? A collaboration with Rails to Trails, an organization that converts old railroad tracks into bike paths, has made information about over 12,000 miles of bike paths available to Google Maps users.
Taking public transit
Millions of people use Google Transit every week, viewing public transit routes on both Google Maps and Google Maps for mobile in over 470 cities around the world. You can take a train from Kyoto to Osaka or find your way around London on the Tube. In some places, you can compare the cost of taking public transit and driving by viewing the calculation below the list of directions (like in this example). Feel free to customize your routes and departure and arrival times under “Show options” to minimize walking or limit the number of transfers. You’ll know if your bus is late by checking out live transit updates.
Being green in the car
According to the 2011 Urban Mobility Report by Texas Transportation Institute at Texas A&M University, motorists wasted 1.9 billion gallons of fuel last year in the US because of traffic congestion, costing the average commuter an additional $713 in commuting costs. You can save time and money by clicking on the Traffic layer in the top right corner to view real-time traffic conditions on your route, and then drag and adjust your route to green. If you need directions in advance, save paper by sending your directions directly to your car, GPS, or phone. The Send-to-Car feature is available to more than 20 car brands worldwide, and the Send-to-GPS feature is available to more than 10 GPS brands. And for those of you who drive electric vehicles, you can search for electric vehicle charging stations by typing “ev charging station in [your city]” and recharge.
As you can see, Google Maps is loaded with features to help you save time, save money, and get where you need to be -- all while minimizing your commute’s impact on the environment.
Wednesday, November 23, 2011
The European Google Trailblazer Awards
Last week in our Zurich office, we held a celebratory event for the 20 winners of the second annual European Google Trailblazer Awards, intended to recognize students that exhibit great potential in science and engineering. The eight girls and 12 boys aged 16-19 were selected for their work in national science, informatics and engineering competitions that took place in Germany, Hungary, Ireland, Romania, Switzerland and the U.K. over the past year. Partnering with each of these competitions, Google engineers awarded “Trailblazer” status to the participants who demonstrated an outstanding use of computing technology in their projects. The aim of the distinction is to reward and encourage these students’ achievements, bring talented students to experience life at Google and show them what a career in computer science can look like, with a special emphasis on how computer science touches every discipline.
 Every Trailblazer winner this year was truly worthy of the title. Ciara, Ruth and Kate, three of the winners of the the BT Young Scientist competition in Ireland, taught themselves to code in order to develop a mobile app for teens to measure their carbon footprints, looking at their use of typical teenage appliances like MP3 players, hair straighteners and computer games. Joszef, one of the winners of the Scientific and Innovation Contest for Youth in Hungary, developed a portable heart monitor combined with GPS that would alert medical services instantly if you were having a heart attack, and include your location so they could respond quickly. Tom and Yannick, winners of the Junior Web Awards in Switzerland, learned HTML and CSS in order to build an interactive health website—and made it available in French, German and English. These are just a few examples.
While at Google Zurich, the Trailblazers covered a wide swath of material, learning about data centers, security and testing, hearing from the Street View team on managing operations in multiple countries and from recruiters on how to write a strong resume. Google engineers chatted about careers in computer science and then tasked the group to solve problems like a software engineer: imitating how a software program might work, the participants lined up in groups of six and had to create an algorithm to reorder themselves without speaking to each other during the re-arranging. For their most in-depth challenge, the students developed and pitched their own award-winning product with guidance from product managers. In just 20 minutes, each student had to come up with product ideas and a pitch—delivered to the product managers—that would convince even Larry Page that their tech product would be the next big thing.
The students left Zurich buzzing about the pathways a career in tech can lead them down, and we can’t wait to see how these young entrepreneurs develop over the next few years.
If you’d like a shot at becoming a Google Trailblazer in 2012, enter one of our partner competitions in Germany, Hungary, Ireland, Romania, Switzerland or the U.K. (you need to be at high school in one of these countries to be eligible for entry). More countries and partner competitions will be added each year, so keep an eye on google.com/edu for further details.
If you’re the organizer of an pre-existing national science and engineering competition in Europe, the Middle East or Africa (EMEA) and would like your competition to be considered for a Trailblazer prize from Google, please complete this form.
Every Trailblazer winner this year was truly worthy of the title. Ciara, Ruth and Kate, three of the winners of the the BT Young Scientist competition in Ireland, taught themselves to code in order to develop a mobile app for teens to measure their carbon footprints, looking at their use of typical teenage appliances like MP3 players, hair straighteners and computer games. Joszef, one of the winners of the Scientific and Innovation Contest for Youth in Hungary, developed a portable heart monitor combined with GPS that would alert medical services instantly if you were having a heart attack, and include your location so they could respond quickly. Tom and Yannick, winners of the Junior Web Awards in Switzerland, learned HTML and CSS in order to build an interactive health website—and made it available in French, German and English. These are just a few examples.
While at Google Zurich, the Trailblazers covered a wide swath of material, learning about data centers, security and testing, hearing from the Street View team on managing operations in multiple countries and from recruiters on how to write a strong resume. Google engineers chatted about careers in computer science and then tasked the group to solve problems like a software engineer: imitating how a software program might work, the participants lined up in groups of six and had to create an algorithm to reorder themselves without speaking to each other during the re-arranging. For their most in-depth challenge, the students developed and pitched their own award-winning product with guidance from product managers. In just 20 minutes, each student had to come up with product ideas and a pitch—delivered to the product managers—that would convince even Larry Page that their tech product would be the next big thing.
The students left Zurich buzzing about the pathways a career in tech can lead them down, and we can’t wait to see how these young entrepreneurs develop over the next few years.
If you’d like a shot at becoming a Google Trailblazer in 2012, enter one of our partner competitions in Germany, Hungary, Ireland, Romania, Switzerland or the U.K. (you need to be at high school in one of these countries to be eligible for entry). More countries and partner competitions will be added each year, so keep an eye on google.com/edu for further details.
If you’re the organizer of an pre-existing national science and engineering competition in Europe, the Middle East or Africa (EMEA) and would like your competition to be considered for a Trailblazer prize from Google, please complete this form.

Afghanistan through maps using Google Map Maker
Striking for its charm, bustle and impressive historic architectural treasures, the silk road city of Herat, Afghanistan has until today, been nearly ‘invisible’ online in digital maps. Luckily, Herat is home to Herat University, which is filled with talented, entrepreneurial students some of whom have worked together to literally put their town “on the (digital) map.”
In response to their city’s absence on Google Maps and Google Earth, a team of students launched a grassroots volunteer effort, named the Afghan Map Makers, to map their country using Google Map Maker, with the vision of reintroducing Afghanistan to its people and the world through its maps. As a result of their efforts, we are proud to re-launch the map of Afghanistan, with a far more detailed Herat --- along with 11 more regions, on Google Maps.

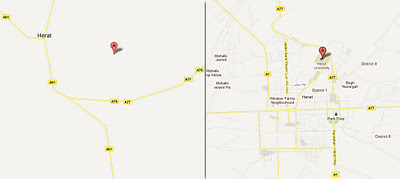 Herat, Afghanistan: The “before and after” efforts of volunteer mappers from Microsis, Afghan Citadel Software Company, Afghan Cybersoft, Asia Cyber Tech, Herat4soo.com and Taktech.
Represented by Hasen Poreya, the Afghan Map Makers presented their project during a June visit to the Mountain View and New York Google offices. According to Hasen, the group encountered many roadblocks from the very beginning; everything from connectivity issues to old satellite imagery and an initial lack of volunteers. Since then, they’ve laid out the map of Herat and several volunteers have already mapped most of Kabul, Afghanistan. You can watch a mapping time lapse of Herat here and Kabul here.
This story is far more significant than the mapping of a city. It is a story of young people in a community coming together, taking ownership of their future and serving their country in a truly entrepreneurial and meaningful way. Congratulations to Hasen, Sadeq, the Herat start-up teams and thousands of Map Makers in more than 180 other countries, helping to map the world.
Herat, Afghanistan: The “before and after” efforts of volunteer mappers from Microsis, Afghan Citadel Software Company, Afghan Cybersoft, Asia Cyber Tech, Herat4soo.com and Taktech.
Represented by Hasen Poreya, the Afghan Map Makers presented their project during a June visit to the Mountain View and New York Google offices. According to Hasen, the group encountered many roadblocks from the very beginning; everything from connectivity issues to old satellite imagery and an initial lack of volunteers. Since then, they’ve laid out the map of Herat and several volunteers have already mapped most of Kabul, Afghanistan. You can watch a mapping time lapse of Herat here and Kabul here.
This story is far more significant than the mapping of a city. It is a story of young people in a community coming together, taking ownership of their future and serving their country in a truly entrepreneurial and meaningful way. Congratulations to Hasen, Sadeq, the Herat start-up teams and thousands of Map Makers in more than 180 other countries, helping to map the world.
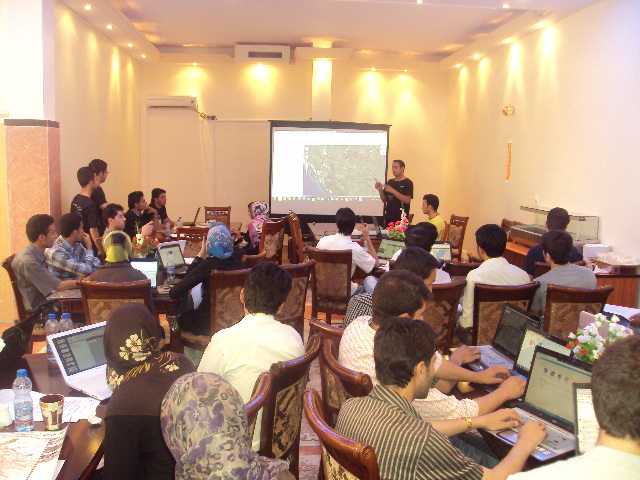
The Afghan Map Maker Team hard at work, mapping Herat, Afghanistan
Led by recent computer science graduates Hasen and Sadeq, along with other volunteers from their tech start-up, Microcis IT Services CO, the Afghan Map Makers realized how mapping could improve Afghanistan’s economic, community and civic development. Starting from old paper maps and basic satellite imagery, the Afghan Map Makers employed unmatched strategy and diligence to map Herat in only a matter of weeks.
Shortly thereafter a new tech start-up incubator, the Herat Information Technology Incubator Program for Herat University entrepreneurs, was founded with the help of Department of Defense, giving five more start-up companies the resources to volunteer spare time to the mapping initiative. The group divided Herat’s map into six equal parts, and each set of volunteers was responsible for mapping a particular section of the city.
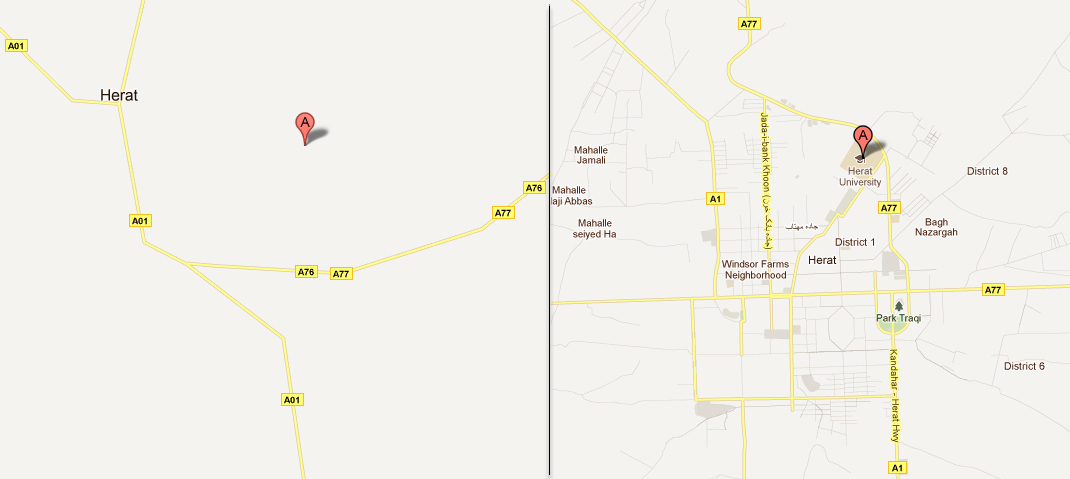 Herat, Afghanistan: The “before and after” efforts of volunteer mappers from Microsis, Afghan Citadel Software Company, Afghan Cybersoft, Asia Cyber Tech, Herat4soo.com and Taktech.
Represented by Hasen Poreya, the Afghan Map Makers presented their project during a June visit to the Mountain View and New York Google offices. According to Hasen, the group encountered many roadblocks from the very beginning; everything from connectivity issues to old satellite imagery and an initial lack of volunteers. Since then, they’ve laid out the map of Herat and several volunteers have already mapped most of Kabul, Afghanistan. You can watch a mapping time lapse of Herat here and Kabul here.
This story is far more significant than the mapping of a city. It is a story of young people in a community coming together, taking ownership of their future and serving their country in a truly entrepreneurial and meaningful way. Congratulations to Hasen, Sadeq, the Herat start-up teams and thousands of Map Makers in more than 180 other countries, helping to map the world.
Herat, Afghanistan: The “before and after” efforts of volunteer mappers from Microsis, Afghan Citadel Software Company, Afghan Cybersoft, Asia Cyber Tech, Herat4soo.com and Taktech.
Represented by Hasen Poreya, the Afghan Map Makers presented their project during a June visit to the Mountain View and New York Google offices. According to Hasen, the group encountered many roadblocks from the very beginning; everything from connectivity issues to old satellite imagery and an initial lack of volunteers. Since then, they’ve laid out the map of Herat and several volunteers have already mapped most of Kabul, Afghanistan. You can watch a mapping time lapse of Herat here and Kabul here.
This story is far more significant than the mapping of a city. It is a story of young people in a community coming together, taking ownership of their future and serving their country in a truly entrepreneurial and meaningful way. Congratulations to Hasen, Sadeq, the Herat start-up teams and thousands of Map Makers in more than 180 other countries, helping to map the world.
Google Docs experience on Android tablet
Earlier this year, we introduced the Google Docs app for Android. Since then, many users have downloaded the app and enjoyed the benefits of being able to access, edit and share docs on the go.
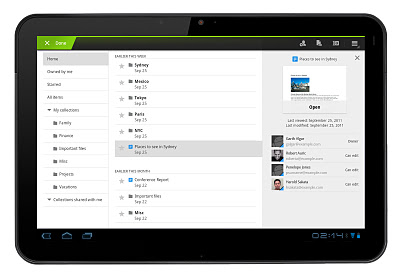
Today’s update to the app makes Google Docs work better than ever on your tablet. With an entirely new design, we’ve customized the look to make the most of the larger screen space on tablets. The layout includes a three-panel view, which allows you to navigate through filters and collections, view your document list, and see document details, all at once.
Looking at the details panel on the right side, you can see a thumbnail to preview a document and its details before opening it. From the panel, you can see who can view or edit any doc.
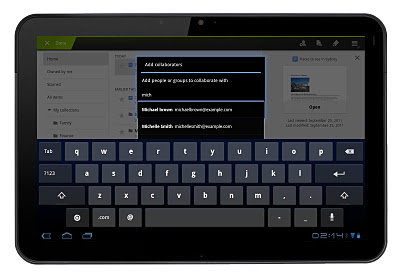 Autocomplete makes sharing with others on the go even easier
These features are now available in 46 languages on tablet devices with Android 3.0+ (Honeycomb) and above.
You can download the app from the Android Market and let us know what you think in the comments or by posting on the forum. Learn more by visiting the help center.
Autocomplete makes sharing with others on the go even easier
These features are now available in 46 languages on tablet devices with Android 3.0+ (Honeycomb) and above.
You can download the app from the Android Market and let us know what you think in the comments or by posting on the forum. Learn more by visiting the help center.
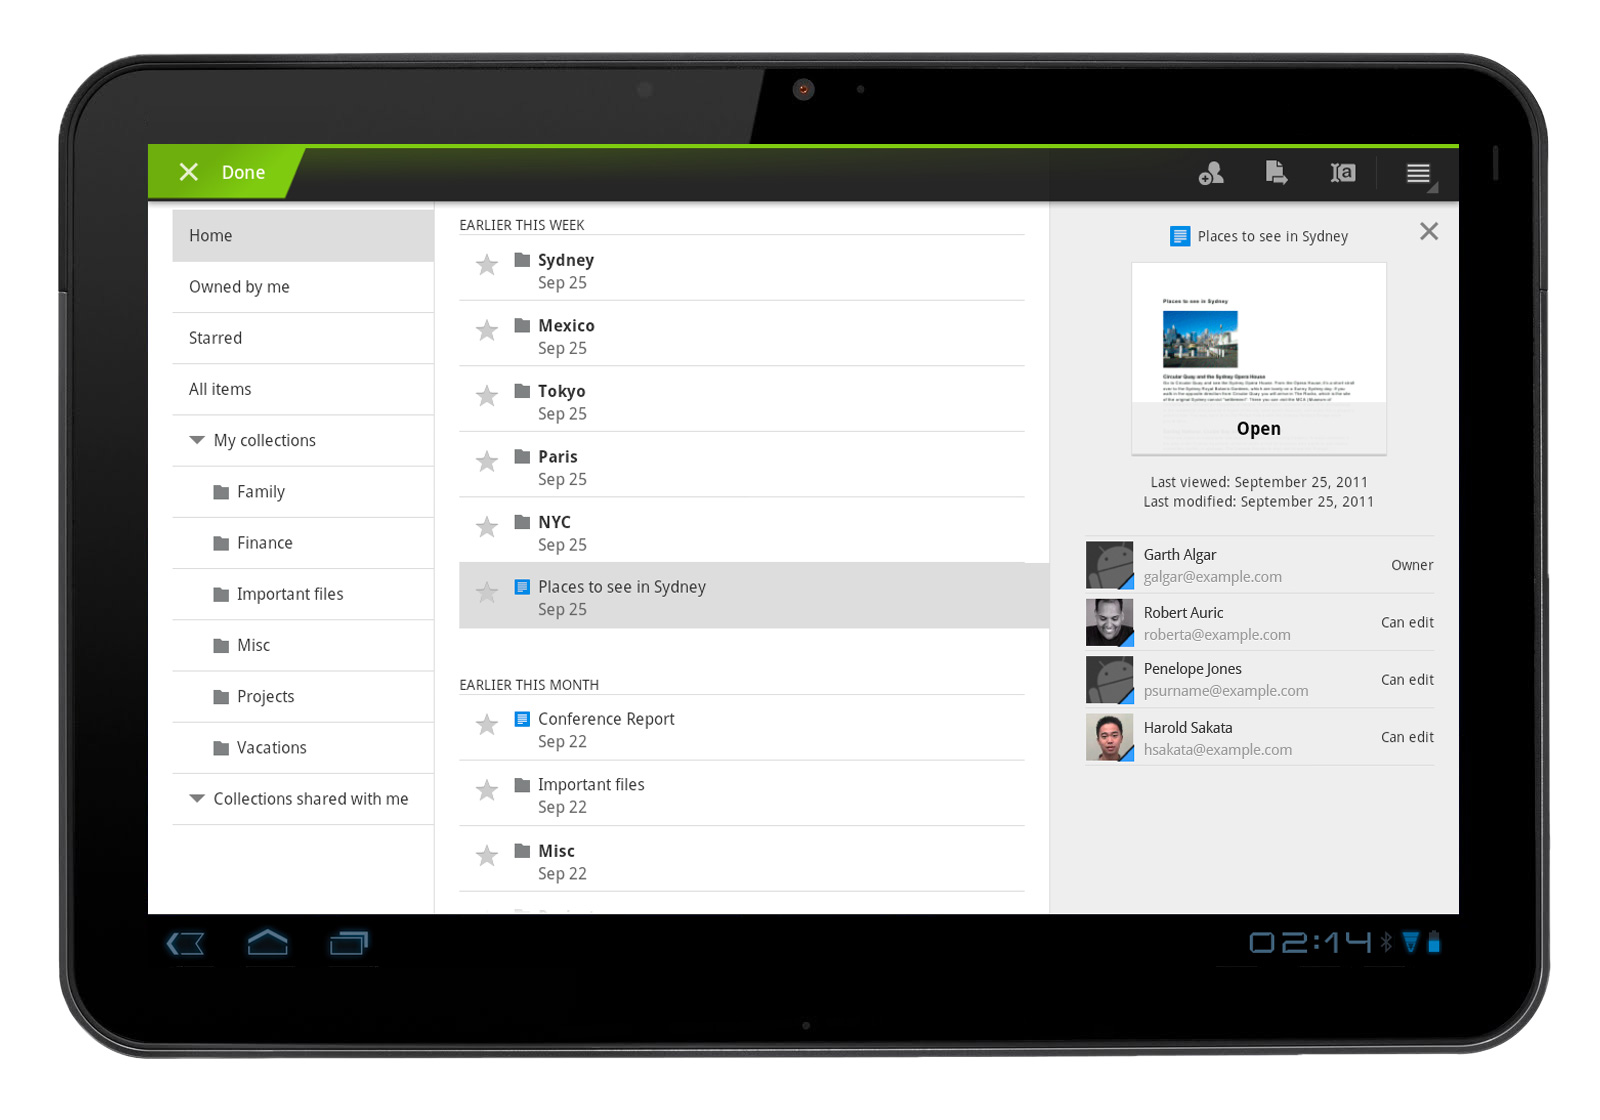
New 3-panel view for improved browsing
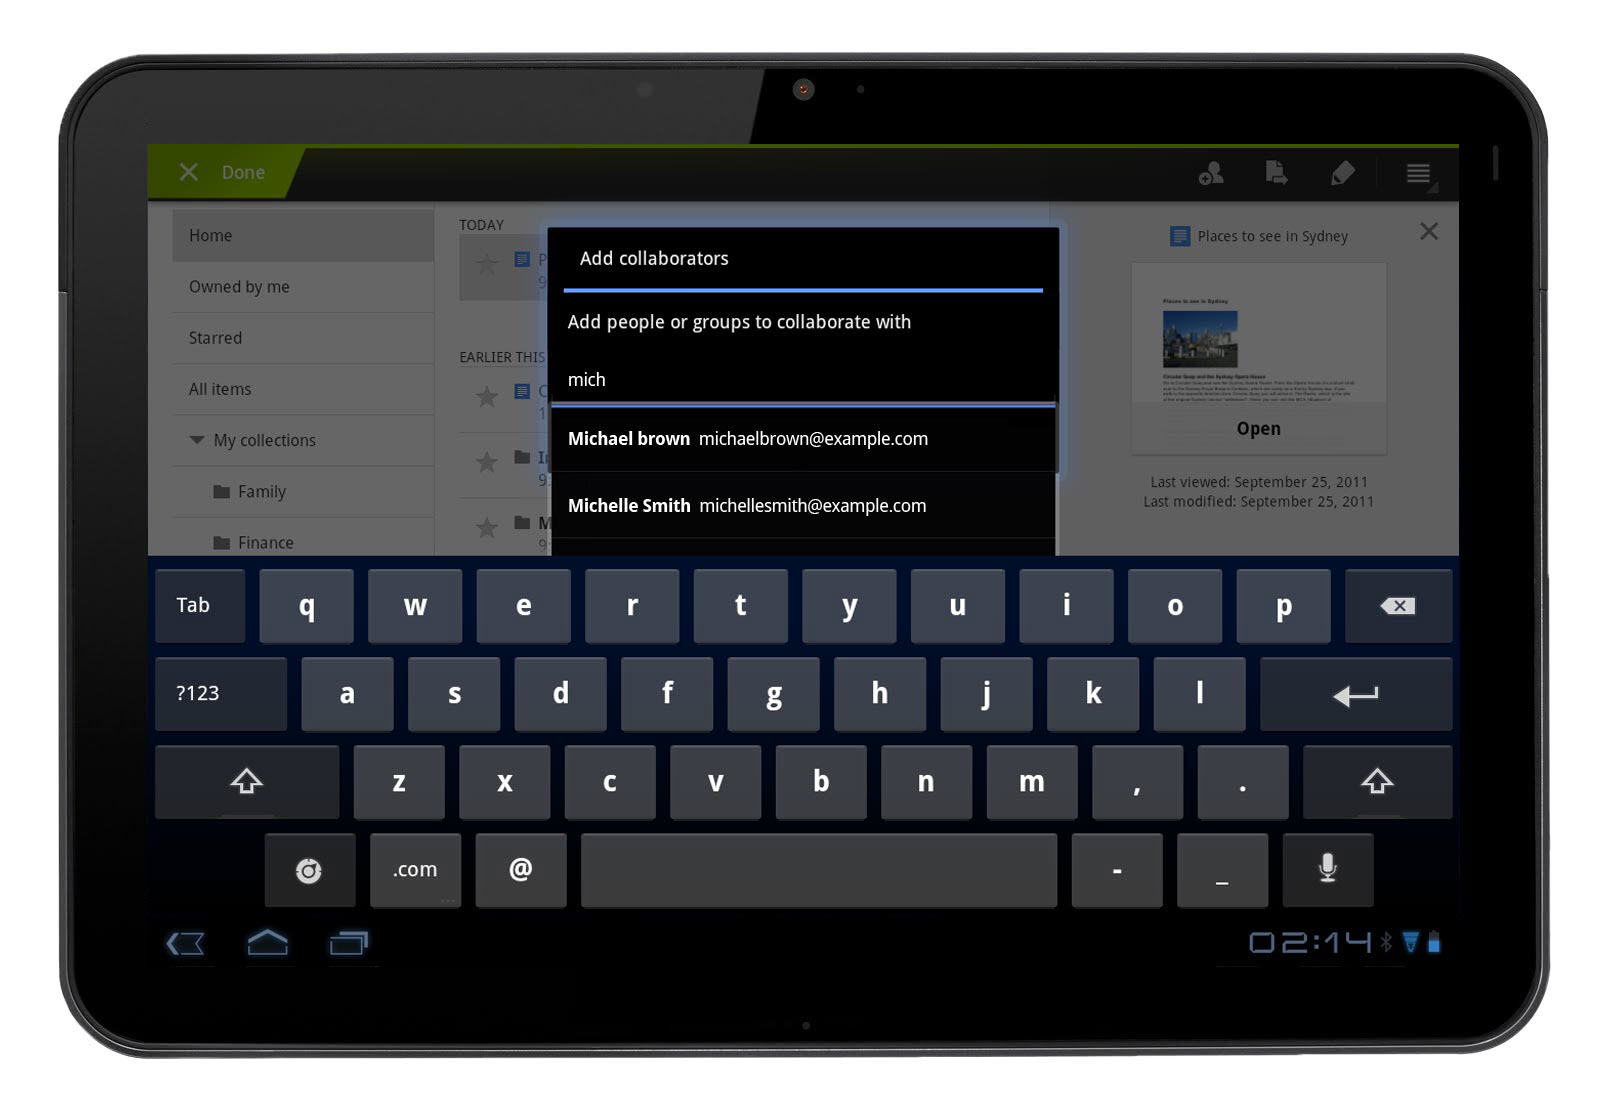 Autocomplete makes sharing with others on the go even easier
Saturday, November 19, 2011
Google Summer of Code students and HelenOS
 This year HelenOS, an operating system based on a multiserver microkernel design originating from Charles University, Prague, had the privilege of becoming a mentoring organization in the Google Summer of Code program. Our preparation began a couple of months before mentoring organizations started submitting their applications, but the real fun hit us when we were accepted as a mentoring organization and when the students started sending us their project proposals.
We put together about a dozen ideas for student projects and received about twenty or so official proposals. HelenOS had three mentors and we were thrilled to be given three student slots for our first year in the program. During the student application period we received a lot of patches from candidate students determined to prove their motivation and ability to work with us. It was no coincidence that the three students we chose submitted some of the most interesting patches and did the most thorough research. Two students sent us enough material to seriously attack the first milestones of their respective projects and the third student fixed several bugs, one of them on the MIPS architecture.
The three selected students were Petr Koupy, Oleg Romanenko and Jiri Zarevucky. Petr and Jiri worked on related projects focused on delivering parts of the C compiler toolchain to HelenOS while also improving our C library and improving compatibility with C and POSIX standards. Oleg chose to further extend our FAT file system server by implementing support for FAT12, FAT32, long file name extension and initial support for the exFAT file system.
When the community bonding period began and we started regular communication with our students, all three mentors, Martin Decky, Jiri Svoboda and Jakub Jermar, noticed an interesting phenomenon. Our students seemed a little shy at first, preferring one-on-one communication with their mentor, as opposed to more open communication on the mailing list. This bore some signs of the students expecting the same kind of interaction a student receives while working on a school project with a single supervisor and evaluator. Even though not entirely unexpected, this was not exactly how we intended for the students to communicate with the HelenOS team but we eventually managed to change this trend.
In short, all three of our students were pretty much technically trouble-free and met their mid-term and final milestones securely. To our relief, this was thanks to the students’ skills rather than projects being too easy. Two of our students were geographically close to their mentors so Jiri and Petr attended one or two regular HelenOS onsite project meetings held in Prague.
Besides the regular monthly team meetings, the HelenOS developers met for an annual coding week event called HelenOS Camp. This year the camp took place during the last coding week of the program and we were excited that one of our Google Summer of Code students, Petr Koupy, was able to join us for the event and hack with the rest of the HelenOS team.
Shortly after Google Summer of Code ended we merged contributions of all three students to our development branch, making their work part of the future HelenOS 0.5.0 release.
Below is a screencast showing HelenOS in its brand new role of a development platform, courtesy of Petr Koupy.
This year HelenOS, an operating system based on a multiserver microkernel design originating from Charles University, Prague, had the privilege of becoming a mentoring organization in the Google Summer of Code program. Our preparation began a couple of months before mentoring organizations started submitting their applications, but the real fun hit us when we were accepted as a mentoring organization and when the students started sending us their project proposals.
We put together about a dozen ideas for student projects and received about twenty or so official proposals. HelenOS had three mentors and we were thrilled to be given three student slots for our first year in the program. During the student application period we received a lot of patches from candidate students determined to prove their motivation and ability to work with us. It was no coincidence that the three students we chose submitted some of the most interesting patches and did the most thorough research. Two students sent us enough material to seriously attack the first milestones of their respective projects and the third student fixed several bugs, one of them on the MIPS architecture.
The three selected students were Petr Koupy, Oleg Romanenko and Jiri Zarevucky. Petr and Jiri worked on related projects focused on delivering parts of the C compiler toolchain to HelenOS while also improving our C library and improving compatibility with C and POSIX standards. Oleg chose to further extend our FAT file system server by implementing support for FAT12, FAT32, long file name extension and initial support for the exFAT file system.
When the community bonding period began and we started regular communication with our students, all three mentors, Martin Decky, Jiri Svoboda and Jakub Jermar, noticed an interesting phenomenon. Our students seemed a little shy at first, preferring one-on-one communication with their mentor, as opposed to more open communication on the mailing list. This bore some signs of the students expecting the same kind of interaction a student receives while working on a school project with a single supervisor and evaluator. Even though not entirely unexpected, this was not exactly how we intended for the students to communicate with the HelenOS team but we eventually managed to change this trend.
In short, all three of our students were pretty much technically trouble-free and met their mid-term and final milestones securely. To our relief, this was thanks to the students’ skills rather than projects being too easy. Two of our students were geographically close to their mentors so Jiri and Petr attended one or two regular HelenOS onsite project meetings held in Prague.
Besides the regular monthly team meetings, the HelenOS developers met for an annual coding week event called HelenOS Camp. This year the camp took place during the last coding week of the program and we were excited that one of our Google Summer of Code students, Petr Koupy, was able to join us for the event and hack with the rest of the HelenOS team.
Shortly after Google Summer of Code ended we merged contributions of all three students to our development branch, making their work part of the future HelenOS 0.5.0 release.
Below is a screencast showing HelenOS in its brand new role of a development platform, courtesy of Petr Koupy.
Friday, November 18, 2011
The AdWords API: Changes to accounts identification
The AdWords API allows you to manage a large number of accounts using a single login credential set. In order to determine which account to run a query against, a customer identifier is required.
Previously we allowed the use of either client email address or client customer ID as account identifier. Using email addresses does not handle a number of situations, though, such as address change, multiple accounts associated with one email and others. In addition, AdWords accounts created with no email address are just not accessible by this identifier.
In order to unify account identification we decided to remove support for email addresses as account identifiers starting with v201109. From this version onward only client customer IDs are supported by the AdWords API.
Migrating to client customer ID
Most applications managing more than one AdWords account hold account identifiers in some form of a local storage. In case your application uses client email addresses as identifiers, you will need to convert those to client customer IDs, or add an extra field for the IDs.
In order to make this migration smoother, we’ve provided an example that demonstrates how to obtain a client ID for a given email address. This example is included in every client library and also available online.
It is easy to change how you identify a client account when making API requests if you use our client libraries. Depending on the language you use, you will need to update the configuration file or constructor parameter to include clientCustomerId instead of clientEmail. In case you construct your queries manually, please refer to the SOAP headers documentation page for more details.
We would like to remind you that all existing versions that support identification by email addresses are scheduled for shutdown in Feb 2012.
Thursday, November 17, 2011
How to Transfer Spatial Data From SQL Server to ESRI Shapefile
There’s plenty of information on the ‘net describing how to import spatial data from ESRI shapefiles into SQL Server . However, what I haven’t seen any examples of yet is how to do the reverse: taking geometry or geography data from SQL Server and dumping it into an ESRI shapefile.
There’s plenty of reasons why you might want to do this – despite its age and relative limitations (such as the maximum filesize per file, limited fieldname length, the fact that each file can contain only a single homogenous type of geometry, etc…), the ESRI shapefile format is still largely the industry standard and pretty much universally read by all spatial applications. Recently, I needed to export some data from SQL Server to shapefile format so that it could be rendered as a map in mapnik, for example (which, sadly, still can’t directly connect to a MS SQL Server database).
So, here’s a step-by-step guide, including the pitfalls to avoid along the way.
Here’s what the contents of this table looks like in the SSMS Spatial Results tab:
 This will fail with a couple of errors, but the first one to address is as follows:
ERROR 1: Attempt to write non-point (LINESTRING) geometry to point shapefile.
SQL Server will allow you to mix different types of geometry (Points, LineStrings, Polygons) within a single column of geometry or geography data. An ESRI shapefile, in contrast, can only contain a single homogenous type of geometry. To correct this, rather than trying to dump the entire table by specifying the tables=OGRExportTable in the connection string, we’ll have to manually select rows of only a certain type of geometry at a time by specifying an explicit SQL statement. Let’s start off by concentrating on the points only. This can be done with the –sql option, as follows:
This time, a new error occurs:
ERROR 1: C:tempsqlexport.shp is not a directory.
ESRI Shapefile driver failed to create C:tempsqlexport.shp
Although our first attempt to export the entire table failed, it still created an output file at C:tempsqlexport.shp. Seeing as we didn’t specify the behaviour for what to do when the output file already exists, when we run OGR2OGR for the second time it has now errored. To correct this, we’ll add the –overwrite flag.
Running again and the error is now:
ERROR 6: Can’t create fields of type Binary on shapefile layers.
Ok, so remember that our original shapefile had two geometry columns. When you create a shapefile, one column is used to populate the shape information itself, while every other column becomes an attribute of that shape, stored in the associated .dbf file. Since the remaining geometry column is a binary value, this can’t be stored in the .dbf file. To resolve this, rather than using a SELECT *, we’ll explicitly specify each column to be included in the shapefile. You could, if you want, then omit the second geometry column completely from the list of selected fields. Instead, I’ll use the ToString() method to convert it to WKT, which can then be stored as an attribute value:
This should now run without errors, although you’ll still get a warning:
Warning 6: Normalized/laundered field name: ‘bufferedshapearea’ to bufferedsh
The names of any attribute fields associated with a shapefile can only be up to a maximum of 10 characters in length. In this case, OGR2OGR has manually truncated the name of the buferedshapearea column for us, but you might not like to use the garbled “bufferedsh” as an attribute name in your shapefile. A better approach would be to specify an alias for long column names in the –sql statement itself. In this case, perhaps just “area” will suffice:
And now, for the first time, you should be both error and warning free:
This will fail with a couple of errors, but the first one to address is as follows:
ERROR 1: Attempt to write non-point (LINESTRING) geometry to point shapefile.
SQL Server will allow you to mix different types of geometry (Points, LineStrings, Polygons) within a single column of geometry or geography data. An ESRI shapefile, in contrast, can only contain a single homogenous type of geometry. To correct this, rather than trying to dump the entire table by specifying the tables=OGRExportTable in the connection string, we’ll have to manually select rows of only a certain type of geometry at a time by specifying an explicit SQL statement. Let’s start off by concentrating on the points only. This can be done with the –sql option, as follows:
This time, a new error occurs:
ERROR 1: C:tempsqlexport.shp is not a directory.
ESRI Shapefile driver failed to create C:tempsqlexport.shp
Although our first attempt to export the entire table failed, it still created an output file at C:tempsqlexport.shp. Seeing as we didn’t specify the behaviour for what to do when the output file already exists, when we run OGR2OGR for the second time it has now errored. To correct this, we’ll add the –overwrite flag.
Running again and the error is now:
ERROR 6: Can’t create fields of type Binary on shapefile layers.
Ok, so remember that our original shapefile had two geometry columns. When you create a shapefile, one column is used to populate the shape information itself, while every other column becomes an attribute of that shape, stored in the associated .dbf file. Since the remaining geometry column is a binary value, this can’t be stored in the .dbf file. To resolve this, rather than using a SELECT *, we’ll explicitly specify each column to be included in the shapefile. You could, if you want, then omit the second geometry column completely from the list of selected fields. Instead, I’ll use the ToString() method to convert it to WKT, which can then be stored as an attribute value:
This should now run without errors, although you’ll still get a warning:
Warning 6: Normalized/laundered field name: ‘bufferedshapearea’ to bufferedsh
The names of any attribute fields associated with a shapefile can only be up to a maximum of 10 characters in length. In this case, OGR2OGR has manually truncated the name of the buferedshapearea column for us, but you might not like to use the garbled “bufferedsh” as an attribute name in your shapefile. A better approach would be to specify an alias for long column names in the –sql statement itself. In this case, perhaps just “area” will suffice:
And now, for the first time, you should be both error and warning free:
 So, now, just repeat the above but substituting the POINT, LINESTRING, and POLYGON geometry types, and creating three separate corresponding shapefiles:
All done, right? Let’s just have a quick check on the created files to make sure they look ok. You can do this using ogrinfo with the –al option, which will give you a summary of the elements contained in any spatial data set. I mean, I’m sure they’re fine and everything, but…. hang on a minute:
Here’s the POINT shapefile:
So, now, just repeat the above but substituting the POINT, LINESTRING, and POLYGON geometry types, and creating three separate corresponding shapefiles:
All done, right? Let’s just have a quick check on the created files to make sure they look ok. You can do this using ogrinfo with the –al option, which will give you a summary of the elements contained in any spatial data set. I mean, I’m sure they’re fine and everything, but…. hang on a minute:
Here’s the POINT shapefile:
 Initially looks ok, the shapefile contains 2 Point features – they’ve got the correct attribute fields, but both points seem to have been incorrectly placed at coordinates of POINT(0.0 2.0). Huh?
What about the LINESTRING shapefile:
Initially looks ok, the shapefile contains 2 Point features – they’ve got the correct attribute fields, but both points seem to have been incorrectly placed at coordinates of POINT(0.0 2.0). Huh?
What about the LINESTRING shapefile:
 This is even worse – even though we specified that only LineString geometries should be returned from the SQL query, the created shapefile thinks it contains 2 Point features (Geometry: Point, near the top). And those points both lie at POINT (0.0 0.0)…
And the POLYGON shapefile:
This is even worse – even though we specified that only LineString geometries should be returned from the SQL query, the created shapefile thinks it contains 2 Point features (Geometry: Point, near the top). And those points both lie at POINT (0.0 0.0)…
And the POLYGON shapefile:
 Same problem as the LineString – it’s effectively an empty Point shapefile.
The problem seems to be that, even though we’re only returning geometries of a certain type from the SQL query, we haven’t explicitly stated that to the shapefile creator, so OGR2OGR is creating three empty shapefiles first (each set up to receive the default geometry type of POINT), and then trying to populate them with unmatching shape types, leading to corrupt data. To explicitly state the geometry type of the shapefiles created, we need to supply the SHPT layer creation option for each shapefile as specified at http://www.gdal.org/ogr/drv_shapefile.html, by adding –lco “SHPT=POLYGON”, –lco “SHPT=ARC” (for LineStrings) etc. as follows:
Unfortunately, that brings us round to almost exactly the same error as we first started with when creating the LineString and Polygon shapefiles (Gah! I thought we’d got rid of them!):
ERROR 1: Attempt to write non-linestring (POINT) geometry to ARC type shapefile
ERROR 1: Attempt to write non-polygon (POINT) geometry to POLYGON type shapefile
We are only selecting geometries of the matching type for each shapefile by filtering the query based on STGeometryType(), so why does OGR2OGR think that we are selecting other types of geometries? What’s more, we haven’t yet explained why the point shapefile (which was, after all, being populated only with point geometries), incorrectly placed both points at coordinates POINT(0.0 2.0). It seems that something is corrupting the results of the SQL statement.
And here’s the “Ta-dah!” moment. According to http://www.gdal.org/ogr/drv_mssqlspatial.html, when retrieving spatial data from SQL Server, “The default [GeometryFormat] value is ‘native’, in this case the native SqlGeometry and SqlGeography serialization format is used”. However, this doesn’t actually appear to hold true. SQL Server stores geometry and geography data in a format very similar to, but slightly different from Well-Known Binary (WKB). The SQL Server binary values for the two points in the OGRExportTestTable are:
The Well-Known Binary of these two points is , instead, as follows:
As you can see, they’re very similar – the coordinate values are serialised as 8-byte floating point binary values in both cases, but the MSSQL Server native serialisation has a different and slightly longer (i.e. one byte more) header. Thus, if OGR2OGR is expecting to receive one type of data, but actually gets the other, all the bytes will be displaced slightly. This could explain both why OGR believed it was receiving the incorrect geometry types and also why the point coordinates were wrong.
To correct this, rather than retrieving the shapegeom value directly, use the STAsBinary() method in the SQL statement to retrieve the WKB of the shapegeom column instead.
Right, we are definitely making progress now. Trying ogrinfo again reveals that all of the layers have the correct number of features, or the appropriate type, and all have the right coordinate values. Yay!
Same problem as the LineString – it’s effectively an empty Point shapefile.
The problem seems to be that, even though we’re only returning geometries of a certain type from the SQL query, we haven’t explicitly stated that to the shapefile creator, so OGR2OGR is creating three empty shapefiles first (each set up to receive the default geometry type of POINT), and then trying to populate them with unmatching shape types, leading to corrupt data. To explicitly state the geometry type of the shapefiles created, we need to supply the SHPT layer creation option for each shapefile as specified at http://www.gdal.org/ogr/drv_shapefile.html, by adding –lco “SHPT=POLYGON”, –lco “SHPT=ARC” (for LineStrings) etc. as follows:
Unfortunately, that brings us round to almost exactly the same error as we first started with when creating the LineString and Polygon shapefiles (Gah! I thought we’d got rid of them!):
ERROR 1: Attempt to write non-linestring (POINT) geometry to ARC type shapefile
ERROR 1: Attempt to write non-polygon (POINT) geometry to POLYGON type shapefile
We are only selecting geometries of the matching type for each shapefile by filtering the query based on STGeometryType(), so why does OGR2OGR think that we are selecting other types of geometries? What’s more, we haven’t yet explained why the point shapefile (which was, after all, being populated only with point geometries), incorrectly placed both points at coordinates POINT(0.0 2.0). It seems that something is corrupting the results of the SQL statement.
And here’s the “Ta-dah!” moment. According to http://www.gdal.org/ogr/drv_mssqlspatial.html, when retrieving spatial data from SQL Server, “The default [GeometryFormat] value is ‘native’, in this case the native SqlGeometry and SqlGeography serialization format is used”. However, this doesn’t actually appear to hold true. SQL Server stores geometry and geography data in a format very similar to, but slightly different from Well-Known Binary (WKB). The SQL Server binary values for the two points in the OGRExportTestTable are:
The Well-Known Binary of these two points is , instead, as follows:
As you can see, they’re very similar – the coordinate values are serialised as 8-byte floating point binary values in both cases, but the MSSQL Server native serialisation has a different and slightly longer (i.e. one byte more) header. Thus, if OGR2OGR is expecting to receive one type of data, but actually gets the other, all the bytes will be displaced slightly. This could explain both why OGR believed it was receiving the incorrect geometry types and also why the point coordinates were wrong.
To correct this, rather than retrieving the shapegeom value directly, use the STAsBinary() method in the SQL statement to retrieve the WKB of the shapegeom column instead.
Right, we are definitely making progress now. Trying ogrinfo again reveals that all of the layers have the correct number of features, or the appropriate type, and all have the right coordinate values. Yay!
 There’s just one nagging thing and that’s the Layer SRS WKT: (unknown). When we converted from the SQL Server native serialisation to Well-Known Binary, we lost the metadata of the spatial reference identifier (SRID) associated with each geometry. This information contains the details of the datum, coordinate reference system, prime meridian etc. that make the coordinates of each geometry relate to an actual place on the earth’s surface. In the shapefile format, this information is contained in a .PRJ file that usually accompanies each .SHP file but, since we haven’t supplied this information to OGR2OGR, none of the created shapefiles currently have associated .PRJ files, so ogrinfo reports the spatial reference system as “unknown”.
To create a PRJ file, we need to append the –a_srs option, supplying the same EPSG id as was supplied when creating the original geometry instances in the table. (Of course, if you have instances of more than one SRID in the same SQL Server table, you’ll have to split these out into separate shapefiles, just as you have to split different geometry types into separate shapefiles)
And here’s the resulting shapefile layers loaded into qGIS:
There’s just one nagging thing and that’s the Layer SRS WKT: (unknown). When we converted from the SQL Server native serialisation to Well-Known Binary, we lost the metadata of the spatial reference identifier (SRID) associated with each geometry. This information contains the details of the datum, coordinate reference system, prime meridian etc. that make the coordinates of each geometry relate to an actual place on the earth’s surface. In the shapefile format, this information is contained in a .PRJ file that usually accompanies each .SHP file but, since we haven’t supplied this information to OGR2OGR, none of the created shapefiles currently have associated .PRJ files, so ogrinfo reports the spatial reference system as “unknown”.
To create a PRJ file, we need to append the –a_srs option, supplying the same EPSG id as was supplied when creating the original geometry instances in the table. (Of course, if you have instances of more than one SRID in the same SQL Server table, you’ll have to split these out into separate shapefiles, just as you have to split different geometry types into separate shapefiles)
And here’s the resulting shapefile layers loaded into qGIS:

Setup
To start with, make sure you’ve got a copy of OGR2OGR version 1.8 or greater (earlier versions do not have the MSSQL driver installed). You can either build it from source supplied on the GDAL page or, for convenience, download and install pre-compiled windows binaries supplied as part of the OSgeo4W package. Now, let’s set up some test data in a SQL Server table that we want to export. To test the full range of OGR2OGR features (or should that say, “the full range of error messages you can create”?), I’m going to create a table that contains two different geometry columns – an original geometry and a buffered geometry, populated using a range of different geometry types:
CREATE TABLE OGRExportTestTable (
  shapeid int identity(1,1),
  shapename varchar(32),
  shapegeom geometry,
  bufferedshape AS shapegeom.STBuffer(1),
  bufferedshapearea AS shapegeom.STBuffer(1).STArea()
);

INSERT INTO OGRExportTestTable (shapename, shapegeom) VALUES
('Point #1', geometry::STGeomFromText('POINT(13 10)', 2199)),
('Point #2', geometry::STGeomFromText('POINT(7 12)', 2199)),
('Line #1', geometry::STGeomFromText('LINESTRING(0 0, 8 4)', 2199)),
('Polygon #1', geometry::STGeomFromText('POLYGON((2 2, 4 2, 4 4, 2 4, 2 2))', 2199)),
('Line #2', geometry::STGeomFromText('LINESTRING(0 10, 10 10)', 2199));

Exporting from SQL Server to Shapefile with OGR2OGR (via a string of errors along the way)
The basic pattern for OGR2OGR usage is given at http://www.gdal.org/ogr2ogr.html, with additional usage options for the SQL Server driver at http://www.gdal.org/ogr/drv_mssqlspatial.html. So, let’s start by just trying out a basic example to export the entire OGRExportTestTable from my local SQLExpress instance to a shapefile at c:tempsqlexport.shp, as follows: (change the connection string to match your server/credentials as appropriate)ogr2ogr -f "ESRI Shapefile" "C:tempsqlexport.shp" "MSSQL:server=localhostsqlexpress;database=tempdb;tables=OGRExportTestTable;trusted_connection=yes;"
ogr2ogr -f "ESRI Shapefile" "C:tempsqlexport.shp"
"MSSQL:server=localhostsqlexpress;database=tempdb;trusted_connection=yes;"
-sql "SELECT * FROM OGRExportTestTable WHERE shapegeom.STGeometryType() = 'POINT'"
ogr2ogr -f "ESRI Shapefile" "C:tempsqlexport.shp"
"MSSQL:server=localhostsqlexpress;database=tempdb;trusted_connection=yes;"
-sql "SELECT * FROM OGRExportTestTable WHERE shapegeom.STGeometryType() = 'POINT'"
-overwrite
ogr2ogr -f "ESRI Shapefile" "C:tempsqlexport.shp"
"MSSQL:server=localhostsqlexpress;database=tempdb;trusted_connection=yes;"
-sql "SELECT shapeid, shapename, shapegeom, bufferedshape.ToString(), bufferedshapearea  FROM OGRExportTestTable WHERE shapegeom.STGeometryType() = 'POINT'"
-overwrite
ogr2ogr -f "ESRI Shapefile" "C:tempsqlexport.shp"
"MSSQL:server=localhostsqlexpress;database=tempdb;trusted_connection=yes;"
-sql "SELECT shapeid, shapename, shapegeom, bufferedshape.ToString(), bufferedshapearea AS area  FROM OGRExportTestTable WHERE shapegeom.STGeometryType() = 'POINT'"
-overwrite
 So, now, just repeat the above but substituting the POINT, LINESTRING, and POLYGON geometry types, and creating three separate corresponding shapefiles:
ogr2ogr -f "ESRI Shapefile" "C:tempsqlexport_point.shp" "MSSQL:server=localhostsqlexpress;database=tempdb;trusted_connection=yes;" -sql "SELECT shapeid, shapename, shapegeom, bufferedshape.ToString(), bufferedshapearea AS area  FROM OGRExportTestTable WHERE shapegeom.STGeometryType() = 'POINT'" -overwrite

ogr2ogr -f "ESRI Shapefile" "C:tempsqlexport_linestring.shp" "MSSQL:server=localhostsqlexpress;database=tempdb;trusted_connection=yes;" -sql "SELECT shapeid, shapename, shapegeom, bufferedshape.ToString(), bufferedshapearea AS area  FROM OGRExportTestTable WHERE shapegeom.STGeometryType() = 'LINESTRING'" -overwrite

ogr2ogr -f "ESRI Shapefile" "C:tempsqlexport_polygon.shp" "MSSQL:server=localhostsqlexpress;database=tempdb;trusted_connection=yes;" -sql "SELECT shapeid, shapename, shapegeom, bufferedshape.ToString(), bufferedshapearea AS area  FROM OGRExportTestTable WHERE shapegeom.STGeometryType() = 'POLYGON'" -overwrite
ogrinfo -al c:tempsqlexport_point.shp
 Initially looks ok, the shapefile contains 2 Point features – they’ve got the correct attribute fields, but both points seem to have been incorrectly placed at coordinates of POINT(0.0 2.0). Huh?
What about the LINESTRING shapefile:
Initially looks ok, the shapefile contains 2 Point features – they’ve got the correct attribute fields, but both points seem to have been incorrectly placed at coordinates of POINT(0.0 2.0). Huh?
What about the LINESTRING shapefile:
 This is even worse – even though we specified that only LineString geometries should be returned from the SQL query, the created shapefile thinks it contains 2 Point features (Geometry: Point, near the top). And those points both lie at POINT (0.0 0.0)…
And the POLYGON shapefile:
This is even worse – even though we specified that only LineString geometries should be returned from the SQL query, the created shapefile thinks it contains 2 Point features (Geometry: Point, near the top). And those points both lie at POINT (0.0 0.0)…
And the POLYGON shapefile:
 Same problem as the LineString – it’s effectively an empty Point shapefile.
The problem seems to be that, even though we’re only returning geometries of a certain type from the SQL query, we haven’t explicitly stated that to the shapefile creator, so OGR2OGR is creating three empty shapefiles first (each set up to receive the default geometry type of POINT), and then trying to populate them with unmatching shape types, leading to corrupt data. To explicitly state the geometry type of the shapefiles created, we need to supply the SHPT layer creation option for each shapefile as specified at http://www.gdal.org/ogr/drv_shapefile.html, by adding –lco “SHPT=POLYGON”, –lco “SHPT=ARC” (for LineStrings) etc. as follows:
Same problem as the LineString – it’s effectively an empty Point shapefile.
The problem seems to be that, even though we’re only returning geometries of a certain type from the SQL query, we haven’t explicitly stated that to the shapefile creator, so OGR2OGR is creating three empty shapefiles first (each set up to receive the default geometry type of POINT), and then trying to populate them with unmatching shape types, leading to corrupt data. To explicitly state the geometry type of the shapefiles created, we need to supply the SHPT layer creation option for each shapefile as specified at http://www.gdal.org/ogr/drv_shapefile.html, by adding –lco “SHPT=POLYGON”, –lco “SHPT=ARC” (for LineStrings) etc. as follows:
ogr2ogr -f "ESRI Shapefile" "C:tempsqlexport_point.shp"
"MSSQL:server=localhostsqlexpress;database=tempdb;trusted_connection=yes;"
-sql "SELECT shapeid, shapename, shapegeom, bufferedshape.ToString(), bufferedshapearea AS area  FROM OGRExportTestTable WHERE shapegeom.STGeometryType() = 'POINT'"
-overwrite
-lco "SHPT=POINT"

ogr2ogr -f "ESRI Shapefile" "C:tempsqlexport_linestring.shp"
"MSSQL:server=localhostsqlexpress;database=tempdb;trusted_connection=yes;"
-sql "SELECT shapeid, shapename, shapegeom, bufferedshape.ToString(), bufferedshapearea AS area  FROM OGRExportTestTable WHERE shapegeom.STGeometryType() = 'LINESTRING'"
-overwrite
-lco "SHPT=ARC"

ogr2ogr -f "ESRI Shapefile" "C:tempsqlexport_polygon.shp" "MSSQL:server=localhostsqlexpress;database=tempdb;trusted_connection=yes;"
-sql "SELECT shapeid, shapename, shapegeom, bufferedshape.ToString(), bufferedshapearea AS area  FROM OGRExportTestTable WHERE shapegeom.STGeometryType() = 'POLYGON'"
-overwrite
-lco "SHPT=POLYGON"
0x00000000010C0000000000002A400000000000002440
0x00000000010C0000000000001C400000000000002840
0x01010000000000000000002A400000000000002440
0x01010000000000000000001C400000000000002840
ogr2ogr -f "ESRI Shapefile" "C:tempsqlexport_point.shp"
"MSSQL:server=localhostsqlexpress;database=tempdb;trusted_connection=yes;"
-sql "SELECT shapeid, shapename, shapegeom.STAsBinary(), bufferedshape.ToString(), bufferedshapearea AS area  FROM OGRExportTestTable WHERE shapegeom.STGeometryType() = 'POINT'"
-overwrite
-lco "SHPT=POINT"

ogr2ogr -f "ESRI Shapefile" "C:tempsqlexport_linestring.shp"
"MSSQL:server=localhostsqlexpress;database=tempdb;trusted_connection=yes;"
-sql "SELECT shapeid, shapename, shapegeom.STAsBinary(), bufferedshape.ToString(), bufferedshapearea AS area  FROM OGRExportTestTable WHERE shapegeom.STGeometryType() = 'LINESTRING'"
-overwrite
-lco "SHPT=ARC"

ogr2ogr -f "ESRI Shapefile" "C:tempsqlexport_polygon.shp" "MSSQL:server=localhostsqlexpress;database=tempdb;trusted_connection=yes;"
-sql "SELECT shapeid, shapename, shapegeom.STAsBinary(), bufferedshape.ToString(), bufferedshapearea AS area  FROM OGRExportTestTable WHERE shapegeom.STGeometryType() = 'POLYGON'"
-overwrite
-lco "SHPT=POLYGON"
 There’s just one nagging thing and that’s the Layer SRS WKT: (unknown). When we converted from the SQL Server native serialisation to Well-Known Binary, we lost the metadata of the spatial reference identifier (SRID) associated with each geometry. This information contains the details of the datum, coordinate reference system, prime meridian etc. that make the coordinates of each geometry relate to an actual place on the earth’s surface. In the shapefile format, this information is contained in a .PRJ file that usually accompanies each .SHP file but, since we haven’t supplied this information to OGR2OGR, none of the created shapefiles currently have associated .PRJ files, so ogrinfo reports the spatial reference system as “unknown”.
To create a PRJ file, we need to append the –a_srs option, supplying the same EPSG id as was supplied when creating the original geometry instances in the table. (Of course, if you have instances of more than one SRID in the same SQL Server table, you’ll have to split these out into separate shapefiles, just as you have to split different geometry types into separate shapefiles)
There’s just one nagging thing and that’s the Layer SRS WKT: (unknown). When we converted from the SQL Server native serialisation to Well-Known Binary, we lost the metadata of the spatial reference identifier (SRID) associated with each geometry. This information contains the details of the datum, coordinate reference system, prime meridian etc. that make the coordinates of each geometry relate to an actual place on the earth’s surface. In the shapefile format, this information is contained in a .PRJ file that usually accompanies each .SHP file but, since we haven’t supplied this information to OGR2OGR, none of the created shapefiles currently have associated .PRJ files, so ogrinfo reports the spatial reference system as “unknown”.
To create a PRJ file, we need to append the –a_srs option, supplying the same EPSG id as was supplied when creating the original geometry instances in the table. (Of course, if you have instances of more than one SRID in the same SQL Server table, you’ll have to split these out into separate shapefiles, just as you have to split different geometry types into separate shapefiles)
The Final Product
So here’s the final script that will separate out points, linestrings, and polygons from a SQL Server table into separate shapefiles, via the WKB format but maintaining the SRID of the original instance, and retaining all other columns as attribute values in the .dbf file. Tested and confirmed to work with columns of either the geometry or geography datatype in SQL Server 2008/R2, or SQL Server Denali CTP3.ogr2ogr -f "ESRI Shapefile" "C:tempsqlexport_point.shp" "MSSQL:server=localhostsqlexpress;database=tempdb;trusted_connection=yes;" -sql "SELECT shapeid, shapename, shapegeom.STAsBinary(), bufferedshape.ToString(), bufferedshapearea AS area FROM OGRExportTestTable WHERE shapegeom.STGeometryType() = 'POINT'" -overwrite -lco "SHPT=POINT" -a_srs "EPSG:2199" ogr2ogr -f "ESRI Shapefile" "C:tempsqlexport_linestring.shp" "MSSQL:server=localhostsqlexpress;database=tempdb;trusted_connection=yes;" -sql "SELECT shapeid, shapename, shapegeom.STAsBinary(), bufferedshape.ToString(), bufferedshapearea AS area FROM OGRExportTestTable WHERE shapegeom.STGeometryType() = 'LINESTRING'" -overwrite -lco "SHPT=ARC" -a_srs "EPSG:2199" ogr2ogr -f "ESRI Shapefile" "C:tempsqlexport_polygon.shp" "MSSQL:server=localhostsqlexpress;database=tempdb;trusted_connection=yes;" -sql "SELECT shapeid, shapename, shapegeom.STAsBinary(), bufferedshape.ToString(), bufferedshapearea AS area FROM OGRExportTestTable WHERE shapegeom.STGeometryType() = 'POLYGON'" -overwrite -lco "SHPT=POLYGON" -a_srs "EPSG:2199"

Subscribe to:
Comments (Atom)