Saturday, March 24, 2012

Ideas Made Real

  The Make Ideas Real project with the goal of creating a showcase of the best SketchUp work from around the world. To build out this showcase, we asked you all to share stories of how SketchUp is helping you to turn your ideas into something tangible. The response has been overwhelming. In just one month, our launch video received nearly quarter million views and several hundred of you took the time to tell us your SketchUp story. Your positive reaction and the quality of the work you’ve shared with us is inspiring, but to truly blow out this showcase, we need to hear from even more of you. If you haven’t yet told us your SketchUp story, share it now by filling out this form. If SketchUp has helped you turn an idea into reality, we want to hear about it. And for your inspiration, here are just a few of the hundreds of quality submissions we’ve received so far:
  Wine Bar design by Bertier Luyt of FranceMore images (See! You can use SketchUp to build a wine bar.)  
  Scout Trebuchet by Peter Leroux and friends of South AfricaMore images | 3D model | Ropes and Poles blog  
  X Games Street and Park Courses by Dug Ketterman of CaliforniaDug's website  
  The Machine by Evan Seccombe of CaliforniaA re-imagined prop from the film Contact, 3D printed

Voice Search in the Middle East

 
The launch of Voice Search in Arabic and Hebrew for Android and iPhone users.
Users in Egypt, Jordan, Kuwait, Lebanon, Qatar, UAE, and Israel can now speak Arabic and Hebrew into their phones to get search results quickly and easily. With this launch, Voice Search is now supported in 29 languages and accents in 37 countries.
When building support for Arabic and Hebrew into our language model we faced some unique challenges, including how to understand words with diacritics (accents that indicate a difference in pronunciation, a linguistic phenomenon called “Nikud” in Hebrew, and “Tashkil” in Arabic) and words appended with other words (“and” for example) that can have many different nuanced meanings.
To train our system we collected over one million utterances in Arabic and Hebrew, using the languages as they are spoken in the more populated parts of each country. For Arabic, we trained the system to recognize Gulf, Levant and Egyptian dialects. While initially we may not accurately recognize words spoken in every regional accent and dialect, one of the major benefits to Google’s cloud-based model is that the more people use Voice Search, the more accurate it becomes.
Availability
How you get started with Google Voice Search depends on what kind of phone you have. If your phone runs Android 2.2 or later, and you see the microphone icon on the Google Search widget on your homescreen, all you have to do is tap the icon to start a voice-powered search. Otherwise, you can install the Voice Search app from Android Market. Note that you can only speak one language into the app at any time and that you may need to change your language setting first.
To get Google Search App for iPhone, search for ‘Google Search App’ in the App Store or follow this link. If you already have Google Search App installed, you can enable voice search by selecting the new languages from the settings panel within the app.

Saturday, March 10, 2012

The WindowTester open source release

We are thrilled to announce the open sourcing release of WindowTester Pro, a solution that automates the process of GUI testing. WindowTester Pro is shipped as a Eclipse plugin and has support for Eclipse versions 3.5, 3.6 and 3.7. WindowTester Pro was previously offered by Instantiations Inc.
Using WindowTester Pro, developers can easily create tests for every GUI they create. The tests generated by WindowTester Pro are standard Java JUnit tests, thus they can be run within your Eclipse environment or they can be automated to run using Ant. Tests can be generated for SWT and Swing Java applications. WindowTester Pro contains a recording console that captures and records keyboard clicks and mouse movements. The first step in test development is to turn on the Record feature and then work with various elements of the UI such as windows or buttons. WindowTester Pro will capture the steps taken.
Once the GUI has been exercised, the developer closes the application under test. When the application is closed, the recording is terminated and the test is generated.
Using WindowTester Pro empowers developers with testing capabilities and reduces the time required to hand-code tests. This enables developers to build quality into the product early in the process because problems are found and resolved earlier in the development cycle. WindowTester Pro can help developers and companies drastically lower both testing time and cost. For more information, please visit the WindowTester Pro home page or join the discussion list. The Googlers who made this open sourcing release possible include Eric Clayberg, Keerti Parthasarathy, Mark Russell, and Seth Hollyman.

Using maps to help protect coral reefs

  Since the early days of Google Earth, organizations have found it to be an excellent tool for tracking the status of coral reefs. Back in 2006, Frank showed you ReefBase and Reef Watch, and we've posted a variety of other stories since then. Coral Reefs cover less than 0.1% of the ocean, yet nearly 25% of all known marine species call them home, making them crucial for our oceans ecosystem. The World Resources Institute has used Google Earth to create tours of reefs around the world to show threats them from sources such as coastal development, pollution, climate-related threats and others.   reefs.jpg  Their tours include photos and underwater video from reefs around the world. Taking it further, they also have created maps to show projected reef maps for the years 2030 and 2050. You can download this KMZ file to explore their current data, or grab the KMZ files for the 2030 or 2050 projects.

Monday, March 5, 2012

Излезе BGmaps for Android - beta | Mapsys.info

Излезе BGmaps for Android - beta | Mapsys.info:

'via Blog this'

SketchUp: A solution for low resolution

  Have you ever brought an image texture into SketchUp and notice that the resolution isn’t as crisp as it is in your image viewer?
  Notice that the image in SketchUp (Right) is not as crisp as the original image (Left)    No, you’re not seeing things. By default, SketchUp downgrades higher resolution image textures to a maximum of 1024 x 1024 pixels because in the past graphics cards didn’t have the horsepower to render models with large textures on screen reliably. If you want to turn off this feature, you can do so by going to Properties > OpenGL, and checking the “Use maximum texture size”. With this checked, SketchUp will no longer downgrade your image textures to 1024px. SketchUp will communicate with your video card and if everything is up to snuff, your image will display at a new maximum resolution of up to 4096 x 4096 pixels.
  With the “Use maximum texture size” selected, the image in SketchUp (Right) displays at a much higher resolution    Important note! Your first inclination might be to activate the “Use maximum texture size” option and bring in the highest resolution textures possible. But as anyone well-versed in the “science” of modeling with textures will tell you, the size of images DO matter. Large textures can bloat the size of your SketchUp model and tax your video card and system memory exponentially. If you are going to use the “maximum texture” option, you will need to be extra conscious about the size of your image textures and choose which ones need to be at a higher resolution.

New App Stats for Publishers on Android Market

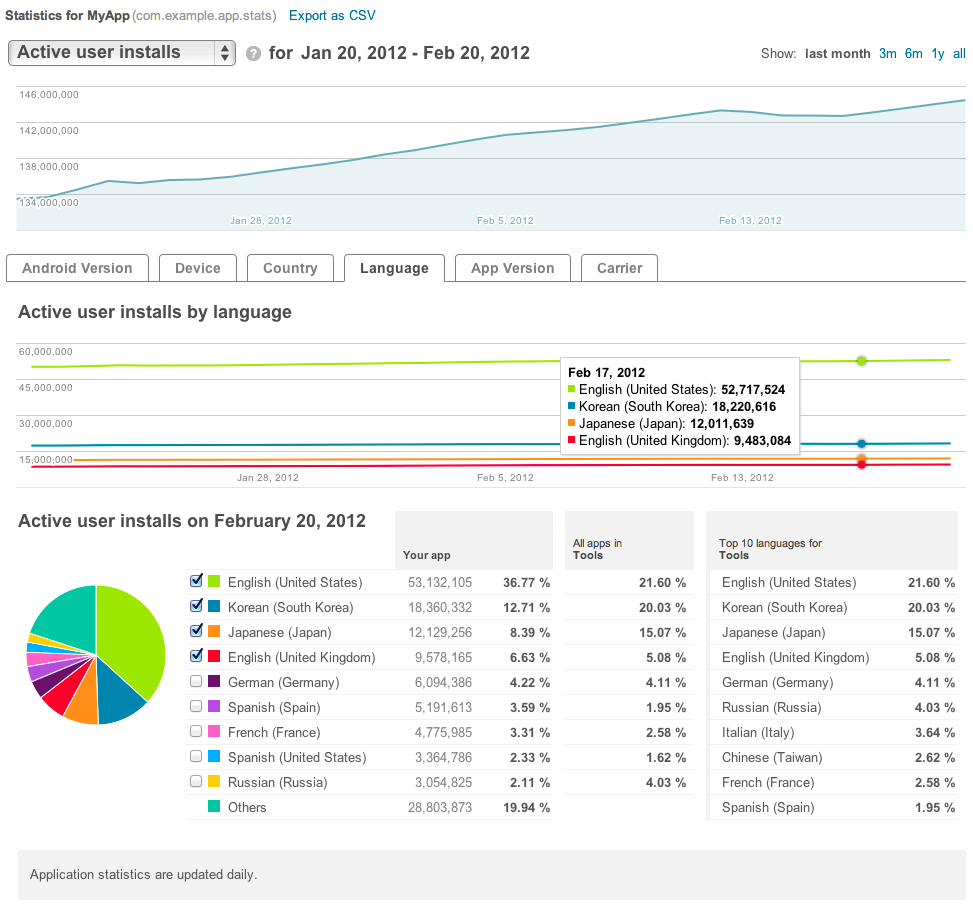
If you've published an app on Android Market, you’ve probably used Application Statistics to help tune your development and marketing efforts. Application Statistics is a set of dashboards in the Developer Console that shows your app’s installation performance across key dimensions such as countries, platform versions, device models, and others. Today we are making Application Statistics even more powerful for publishers, adding new metrics, new ways to analyze your data, and a redesigned UI that’s much easier to use.
First, we are adding important new installation metrics to the dashboards. You can now see your installations measured by unique users, as well as by unique devices. For user installations, you can view active installs, total installs, and daily installs and uninstalls. For devices, you can see active installs as well as daily installs, uninstalls, and upgrades. Along with the new metrics, we’re also introducing two new data dimensions — Carrier and App Version. You can use them to track your app’s installation trends across mobile operators or monitor the launch metrics of specific app updates. To give you visibility over your installation data over time, we’re adding timeline charts for all metrics and dimensions. At a glance, these charts highlight your app’s installation peaks and longer-term trends, which you can correlate to promotions, app improvements, or other factors. You can even focus in on data inside a dimension by adding specific points (such as individual platform versions or languages) to the timeline. Finally, we’re bringing you all of the new metrics, dimensions, and timelines in a completely redesigned UI that is faster, more compact, and easier to use. Each dimension is now displayed in dedicated tab, making it easier to click through your stats daily or as often as needed. If you track your stats in another tool, we’re also adding an export capability that lets you download your stats in a single CSV file. Check out the new Application Statistics next time you visit the Android Market Developer Console. We hope they’ll give you new insight into your app’s user base and installation performance. Watch for related announcements soon — we are continuing to work on bringing you the reporting features you need to manage your products successfully on Android Market.
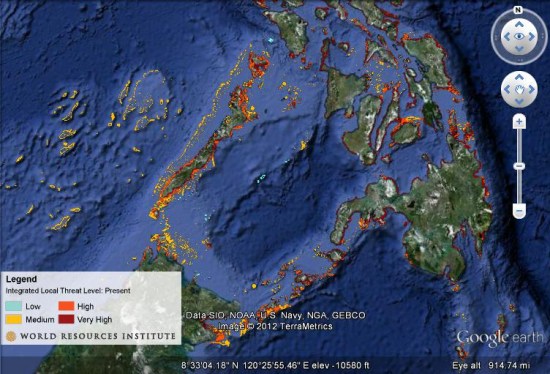
Share This: