Monday, May 30, 2011
Free data a GFC casualty
The US government has been a proponent of free data for quite a while now and over the years it established a number of national programs to allow easy access to wast resources of public information. However, the annual budgets for e-government initiatives were slashed by 75% last month, putting in question the survival of such programs like data.gov (it is the repository for publicly available data that was promised as a platform to power software and analysis created by and for the public). Comments from federal CIO Vivek Kundra indicate that data.gov will not be shut down but “…there will be no enhancements or other development to address needs for improvement”. So, although the policy of free data remains unchanged, significant cost of delivering that policy may be its ultimate “undoing”.
Meantime, in Australia, the progress towards opening up government data vaults has taken another step forward. Earlier this week Australia's Information Commissioner, John McMillan, unveiled eight new rules for Federal agencies to adhere to when considering the publication of government data. These rules are:
Despite the launch of data.gov.au portal, there is no federal program in Australia to facilitate access to public data on a large scale (ie. the US style) and the onus so far is on individual agencies to manage the dissemination of public information in their possession. State and Territory governments are pursuing their own initiatives. This “piecemeal approach”, although slower in implementation, may prove to be a more sustainable model for enabling access to public data, considering the vulnerability of large scale initiatives to budgetary pressures of the government of the day in these uncertain times.
Meantime, in Australia, the progress towards opening up government data vaults has taken another step forward. Earlier this week Australia's Information Commissioner, John McMillan, unveiled eight new rules for Federal agencies to adhere to when considering the publication of government data. These rules are:
- Open access to information – a default position,
- Engaging the community,
- Effective information governance,
- Robust information asset management,
- Discoverable and useable information,
- Clear reuse rights,
- Appropriate charging for access, [So, not entirely free access!]
- Transparent enquiry and complaints processes
Despite the launch of data.gov.au portal, there is no federal program in Australia to facilitate access to public data on a large scale (ie. the US style) and the onus so far is on individual agencies to manage the dissemination of public information in their possession. State and Territory governments are pursuing their own initiatives. This “piecemeal approach”, although slower in implementation, may prove to be a more sustainable model for enabling access to public data, considering the vulnerability of large scale initiatives to budgetary pressures of the government of the day in these uncertain times.
Sunday, May 29, 2011
Southeast U.S. Tornado Tracks
It’s amazing how clear the damage from tornadoes appears in satellite imagery. Above, an ASTER visible-infrared image of a tornado’s path near Tuscaloosa, Alabama: “In the picture, captured just days after the storm, pink represents vegetation and aqua is the absence of vegetation. The tornado ripped up everything in its path, scouring the Earth’s surface with its terrible force. The ‘tearing up’ of vegetation makes the tornado’s track stand out as a wide swath of aqua.” NASA’s Earth Observatory also has a set of satellite photos of the tornado tracks.
How Brown University’s IT Dept uses Apps Script
In 170-person IT department at Brown University, had a less-than-ideal way of sharing sick/vacation time among coworkers: sending an email to a Listserv. This was inefficient - mails were not written in a standard format, so it was difficult to determine who would be out on a certain date. Some teams would notify each other of time off by sending personal invites to their vacation events, but this resulted in cluttered calendars.

The script:
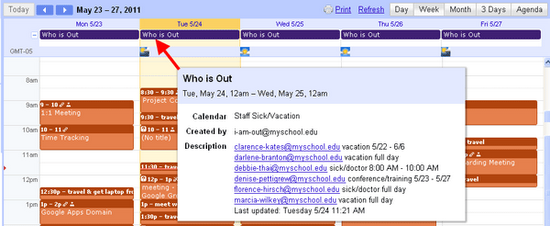
A single daily event on a shared calendar contains the list of who is out that day.
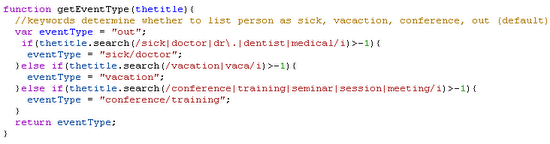
Code snippet - function which determines the type of event based on keywords in the event title. The keywords were chosen with the help of our HR Manager and several co-workers.
Something that streamlined the process was using up a dedicated email address for the calendar and script. This allows people to invite a simple, easy-to-remember email address to their vacation events and gave us a neutral place to store the script (not a personal account).
One issue I ran into while writing the script was that the user who created the event wasn't always the person who was out of the office because assistants often put these events on calendars. I received great feedback from the Apps Script forum. This is essential because we do delegated calendaring, and assistants put vacation events on the calendars they manage.
I’m not employed as a programmer - I’m a trainer with some self-taught ActionScript, JavaScript and PHP skills, and I found it very easy to wrap my head around Google Apps Script.
The Solution
Since most of my coworkers were already creating events on their calendar to indicate their vacations, a calendar-based solution seemed most convenient. The script I wrote simply requires them to perform one additional step: when creating their vacation event, they invite a specific email address as a guest.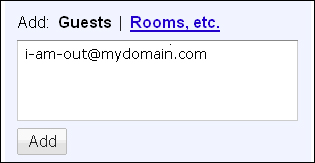
The script:
- Aggregates events from the invited ‘out’ calendar, keeping only the relevant information: person, date, and type of event (from keywords like vacation, sick/doctor, or conference)
- Creates a single daily event on another calendar with the day’s “who is out” list. We can overlay this calendar onto our own without having an overwhelming amount of individual “out” events.
- Each morning around 9am, the daily Out list is automatically posted on a Google Site.
A single daily event on a shared calendar contains the list of who is out that day.
Code snippet - function which determines the type of event based on keywords in the event title. The keywords were chosen with the help of our HR Manager and several co-workers.
Something that streamlined the process was using up a dedicated email address for the calendar and script. This allows people to invite a simple, easy-to-remember email address to their vacation events and gave us a neutral place to store the script (not a personal account).
One issue I ran into while writing the script was that the user who created the event wasn't always the person who was out of the office because assistants often put these events on calendars. I received great feedback from the Apps Script forum. This is essential because we do delegated calendaring, and assistants put vacation events on the calendars they manage.
I’m not employed as a programmer - I’m a trainer with some self-taught ActionScript, JavaScript and PHP skills, and I found it very easy to wrap my head around Google Apps Script.
Wednesday, May 25, 2011
Google Earth: Weather and storm tracking tools
A few years ago, Frank collected a variety of weather-related tools for Google Earth and put them into a nice package. Since then, a few of those tools have disappeared and a few new ones have been added, so I've rebuilt the collection with those changes made.
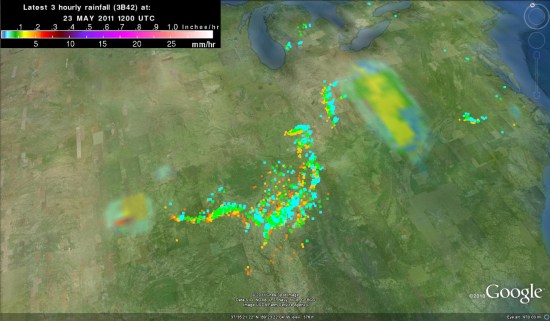
Two of the big contributors to the old file were GUIweather and WeatherBonk, and both sites are now completely gone. They both provided some excellent data, so it's quite a shame that they're gone. However, we've now added data from the World-Wide Lightning Location Network and NASA Goddard's TRMM Project.
If you already have a copy of the old network link, it should automatically refresh with the new information. Either way, you can download the KMZ file here.
If you have other valuable data that you think should be included, please leave a comment and include a link to their KML/KMZ data that we can include.
Google Maps Sneek Peek
Search - Google Maps Sneek Peek
Google are testing and this may not be available to all web users...
Highlight the map area of interest by search.

Useful for Countries, Administrative, City Limits and even Islands.
Great for people who are looking but don't necessarily now the shape or administrative regions Zipcodes in the US, Postal Codes in Canada (but not UK postcode sectors).
Google are testing a highlighting method for the users search

London (Westminster London) is automatically highlight when users do a search on google.com
Tuesday, May 24, 2011
Google loosing its Midas touch?
Google will have to add another failure to its list – the company has just announced withdrawal of Real Estate listing service from Google Maps. It is partly the result of discontinuation of Google Base API but the primary cause quoted in the announcement is “low usage”. I appears that “economic reality” prevailed over somehow philanthropic ambitions of Google to provide “free services for all” – at stake was a huge revenue flow from advertising from subscription based real estate portals – and that is the main game for Google.
Real estate listings on Google Maps and via Google Base API service were available for US, Australia, New Zealand, the UK and Japan. Many anticipated far reaching changes in real estate online listing market as the result of Google’s entry, including the author of this blog, but we were all proven wrong. No hard feelings on my part as it opens up new opportunities since Google left a big niche ready to be explored but it begs a question, what went wrong for Google? I believe that the main cause was the service was just an add-on layer to Google Map and, to my best knowledge, listings were never promoted in online search. Google lacked clear vision for the service and was never committed to push it in any big way, not to upset its largest advertising clients. Otherwise who knows what might have happened…
Google is indeed struggling with creating thematic content for its main map platform so it is no surprise the company decided in the end to leave real estate listings to third party developers. Is Google starting to loose its Midas touch? Initially it looked that they cannot make any wrong move – search engine dominance, online advertising platform dominance, online video dominance… But more recent explorations and experimentations seem not to deliver the expected results.
News and Fairfax, and their associated real estate portals realestate.com.au and domain.com.au, stood their grounds and did not want to participate in Google’s experiments. REA Group (realestate.com.au) share price more than doubled since Google entered the market in July 2009 and despite growing dissatisfaction with the service from real estate agents. Fairfax shares are only slightly up. If one had “blinked”, the outcome could have been totally different… So, for now, back to status quo - it will have to be someone else, not Google, who will shake the things up for them. Telstra was not so lucky and in the end it opted for tighter cooperation with Google (now not only providing listings for Google's local search from its Yellow Pages but also map data for Google Map).
Bing Maps: Two new store locator templates
As Multimap and MapPoint Web Service customers know, Microsoft will consolidate services to the Bing Maps platform effective November 18, 2011. While there is a substantial amount of helpful information available at our migration portal, including a devoted page to our migration partners, we wanted to highlight two store locator templates that have proven helpful to customers.

InKnowledge’s Bing Maps Locator Wizard was built around multiple Microsoft technologies, including Bing Maps AJAX Control 7.0, Bing Maps REST services, Bing Spatial Data Services, Windows Azure, SQL Azure and MVC3. Customers can use the basic locator to customize their site within minutes, and have the option to download or host in Windows Azure through InKnowledge’s portal (the service is free.) For more information, check out a preview video, or a more expansive overview video. If you’d rather read about the template, check out this blog entry from InKnowledge’s Ricky Brundritt.

Shoothill’s My Store Locator template will be launched on Wed, May 18 during a Bing Maps webcast. The template was built using Bing Maps, Visual Studio 2010, Expressions Web 4, Hyper-V virtualisation technologies, Windows Azure and SQL Azure. As well as targeting former Multimap customers to enable them to make a seamless transition to the Bing Maps platform, the My Store Locator can assist any business seeking to migrate to Bing Maps from any mapping platform.
InKnowledge’s Bing Maps Locator Wizard was built around multiple Microsoft technologies, including Bing Maps AJAX Control 7.0, Bing Maps REST services, Bing Spatial Data Services, Windows Azure, SQL Azure and MVC3. Customers can use the basic locator to customize their site within minutes, and have the option to download or host in Windows Azure through InKnowledge’s portal (the service is free.) For more information, check out a preview video, or a more expansive overview video. If you’d rather read about the template, check out this blog entry from InKnowledge’s Ricky Brundritt.
Shoothill’s My Store Locator template will be launched on Wed, May 18 during a Bing Maps webcast. The template was built using Bing Maps, Visual Studio 2010, Expressions Web 4, Hyper-V virtualisation technologies, Windows Azure and SQL Azure. As well as targeting former Multimap customers to enable them to make a seamless transition to the Bing Maps platform, the My Store Locator can assist any business seeking to migrate to Bing Maps from any mapping platform.
Monday, May 23, 2011
Sunday, May 22, 2011
Finding your nearest SQL Server Usergroup
As somebody interested in all things spatial, I was delighted that the community corner at SQLBits8 featured an interactive mapping application. Many people commented on how much work had obviously gone into the user interface: the ability to add “pushpins” was particularly realistic, and the base dataset, despite being centred on the UK, was designed to be modular and extendable – with users adding in further layers for Italy, Germany, Holland, Sweden, Norway, Denmark, Austria and Australia.
If you’re wondering, the application front-end interface in question looked like this: (red pins are usergroup locations, blue pins are attendees)

The purpose of the map was obviously both to visualise the geographic distribution of attendees coming to SQLBits, as well as to show people the location of their closest usergroup. Seeing as this was a SQL Server conference, it gave me an idea on how you could analyse this information with SQL Server spatial…
Displaying Locations of UK SQL Server Usergroups
To start with, we can create a table with geography points representing regional SQL Server usergroups in the UK (information kindly provided by tsqltidy).
To show the locations where each usergroup is held, we can then simply select each point, buffer them by a reasonable amount (10,000m, in this case), and display them against a background map of Great Britain.
SELECT name, location.STBuffer(10000) FROM SQLServerUGs;
Here’s what the results of that query look like in the SSMS Spatial Results tab:

That’s the objective of visualising the locations of all UK usergroups completed…. now, what about the other purpose of the map – to let users located their closest usergroup. This is commonly known as a “nearest-neighbour” query. So how would we go about doing this?
Nearest-Neighbour Queries
I don’t know the actual locations of all the attendees of SQLBits, and I can’t be bothered to trace their locations from the little blue pins in the first photo of this post, so let’s create some dummy data instead. The following code will create a table containing the locations of 800 fictional attendees, all situated somewhere on GB mainland (maybe there are some SQL Server DBAs out in the North Sea on oil rigs or pirate ships, but let’s just assume not for the sake of simplicity):CREATE TABLE #SQLBitsAttendees (
id int identity(1,1),
location geography
);
SET NOCOUNT ON;
DECLARE @i int = 0;
WHILE @i < 800 BEGIN
DECLARE @p geography;
SET @p = geography::Point(RAND()*10+50, RAND()*8-6, 4326);
IF (@p.STIntersects(@GB)=1)
BEGIN
INSERT INTO #SQLBitsAttendees(location) VALUES (@p)
SET @i = @i + 1;
END
END
And here they all are (including a fictional attendee from the Shetland Islands, from the looks of it):

Now, to find out the location of the closest usergroup for each attendee, you could use the STDistance() method to measure and sort the distance from each usergroup, then select the TOP 1 closest in a subselect, as follows:
SELECT
id,
location,
(SELECT TOP 1 name
FROM #SQLServerUGs ug
ORDER BY ug.location.STDistance(a.location)
) AS nearestUG
FROM #SQLBitsAttendees a

The problem with this approach is that, in order to determine the closest usergroup, the subselect statement has to evaluate the distance from every usergroup, only to select the top one. What’s more, in SQL Server 2008/R2 this query cannot take advantage of an index (spatial or otherwise), so it involves a full scan of the usergroups table for every attendee. Not good.
In SQL Server Denali, there’s a new nearest-neighbour query plan that does allow the query optimiser to use a spatial index for these types of queries, so long as they are expressed using a particular pattern. To use the nearest-neighbour plan in SQL Server Denali for this example, we have to add a IS NOT NULL condition to the STDistance() method, as follows:
SELECT
id,
location,
(SELECT TOP 1 name
FROM #SQLServerUGs ug
WHERE ug.location.STDistance(a.location) IS NOT NULL
ORDER BY ug.location.STDistance(a.location)
) AS nearestUG
FROM #SQLBitsAttendees a
This improves the performance significantly, but it’s still not an ideal query design.
One alternative approach could be to place a constraint on the subselect query, by assuming that nobody wants to travel more than 100km to attend a usergroup:
SELECT
id,
location.STAsText(),
(SELECT TOP 1 name
FROM #SQLServerUGs ug
WHERE ug.location.STDistance(a.location) < 100000
ORDER BY ug.location.STDistance(a.location)
) AS nearestUG
FROM #SQLBitsAttendees a
The advantage of this approach is that a spatial index can be used to fulfil the STDistance()query predicate (in both SQL Server 2008 and Denali), so this can efficiently reduce the number of rows that need to be evaluated and sorted. An added benefit is that it also allows us to identify all those users who are further than 100km from their closest usergroup, since the subselect will return NULL for those records:

(Perhaps users with a NULL nearestUG should consider starting their own local group?)
This approach is still not perfect though, since it relies on a fairly arbitrary limit of 100km for the limit within which to search. Setting this limit too high and we leave ourselves with a lot of data still to sort. But set it too low and some keen DBAs and Devs might be willing to travel further than the specified limit, and would miss out on knowing what their closest UG would be.
Another alternative solution, first proposed by Isaac Kunen, is to make use of a numbers table to create a query that looks for nearest neighbours in an expanding series of search ranges. The initial search area is set small, but then expands exponentially outwards until a neighbour is found. A query using this logic looks something like this:
DECLARE @start FLOAT = 1000;
WITH NearestUGs AS
(
SELECT TOP(1) WITH TIES *, T.g.STDistance(@x) AS dist
FROM Numbers JOIN T WITH(INDEX(spatial_index))
ON T.g.STDistance(@x) < @start*POWER(2,Numbers.n)
ORDER BY n
)
SELECT TOP(1) * FROM NearestUGs
ORDER BY n, dist
(for explanation of what’s going on here, I suggest you refer to Isaac’s post).
Empirically, this query works pretty well – but it’s not exactly pretty to look at and it’s pretty daunting unless you’re proficient with fairly advanced T-SQL as well as with the nuisances of dealing with spatial data. So, there’s still scope for a better solution.
Enter Voronoi diagrams…
Voronoi Diagrams
A Voronoi diagram is a formed from a set of underlying points (called Voronoi sites). Around each site is a Voronoi cell, which is the area made up of all those points that lie closest to that site than to any other site. The edges at which two Voronoi cells meet is therefore constructed from all those points that lie equidistant between the two sites.The complete set of Voronoi cells form a tessellating, non-overlapping set of of Polygons that cover the full extent of a set of data, known as a Voronoi tessellation.
Voronoi diagrams are closely related to Delauney triangulations (which I also used in my post about alpha shapes). In fact, if you connect the circumcenters of all the triangles in a Delauney triangulation, you’ll create a Voronoi tessellation of the original set of points, as shown below:

Delauney triangulation (black lines) and Voronoi tessellation (red lines) of a set of points. Image from http://en.wikipedia.org/wiki/File:Delaunay_Voronoi.png
The simplest (although not necessarily the most efficient) way to construct the Voronoi tessellation of a set of points is to take advantage of this duality. First, create the Delauney triangulation of the points, and then connect the circumcenters of all those triangles that have a common vertex to create the Voronoi cell around the site at that vertex. You can find more details on the algorithms required to create Delauney Triangulations and Voronoi tessellations at http://www.cs.cmu.edu/~quake/triangle.html and http://paulbourke.net/papers/triangulate/, as well as plenty of other resources on the internet. You know where to look.
What’s all this got to do with nearest neighbour queries? Well, suppose we create a Voronoi tessellation based on the set of points representing the location of SQL Server UGs. The result will be a set of (convex) polygons, in which each polygon contains exactly one usergroup, and all those points closest to that usergroup than to any other. If we store each Voronoi cell as a geography Polygon and clip them to the outline map of Great Britain, we get something a bit like this:

You can think of the coloured polygons as representing the “catchment area” for each of the usergroups. In order to work out the closest usergroup for any attendee, all we therefore have to do is to work out which polygon their location lies in, which can be done with a simple STIntersects() query:
SELECT
a.id,
a.location,
ug.name AS nearestUG
FROM #SQLBitsAttendees a
JOIN SQLServerUGs ug ON a.location.STIntersects(ug.area) = 1
And here they all are, assigned to the correct UG, and much quicker than any of the preceding queries (as the STIntersects() predicate is fully capable of taking advantage of any spatial index):


The only thing to remember is that you will have to recreate the underlying Voronoi tessellation every time the distribution of usergroups changes (i.e. every time a usergroup is added/removed/or starts meeting at a new location). However, we can probably safely assume that new usergroups don’t pop up every day, and it doesn’t take that long to recreate the tessellation anyway. For nearest-neighbour queries where the “neighbours” are relatively static, Voronoi tessellations are therefore a very good choice.
You can download the code used in the examples above from here.
Mississippi floods: images and data
Emerging as one of the worst flooding events along the U.S. waterway in the past century, the Mississippi River floods of April and May 2011 have caused widespread destruction along the 2,300 mile river system. Historically high water levels from heavy rains and springtime snowmelt have provided no shortage of dramatic scenes -- levees breached, downtown areas completely submerged, spillways opened, and more.
The Google Crisis Response team has assembled a collection of flood data including satellite imagery for impacted cities along the river from GeoEye, flood extent and crest data forecasts from the US Army Corps of Engineers (kml) and NOAA’s National Weather Service (kml), and shelter locations from the American Red Cross (kml).

This collection of data is available on Google Maps by searching for “Mississippi flooding.” These data can also be accessed within Google Earth by turning on the ‘Places’ layer and flying to the Mississippi river south of Memphis, TN, or by downloading this kml
The Google Crisis Response team has assembled a collection of flood data including satellite imagery for impacted cities along the river from GeoEye, flood extent and crest data forecasts from the US Army Corps of Engineers (kml) and NOAA’s National Weather Service (kml), and shelter locations from the American Red Cross (kml).
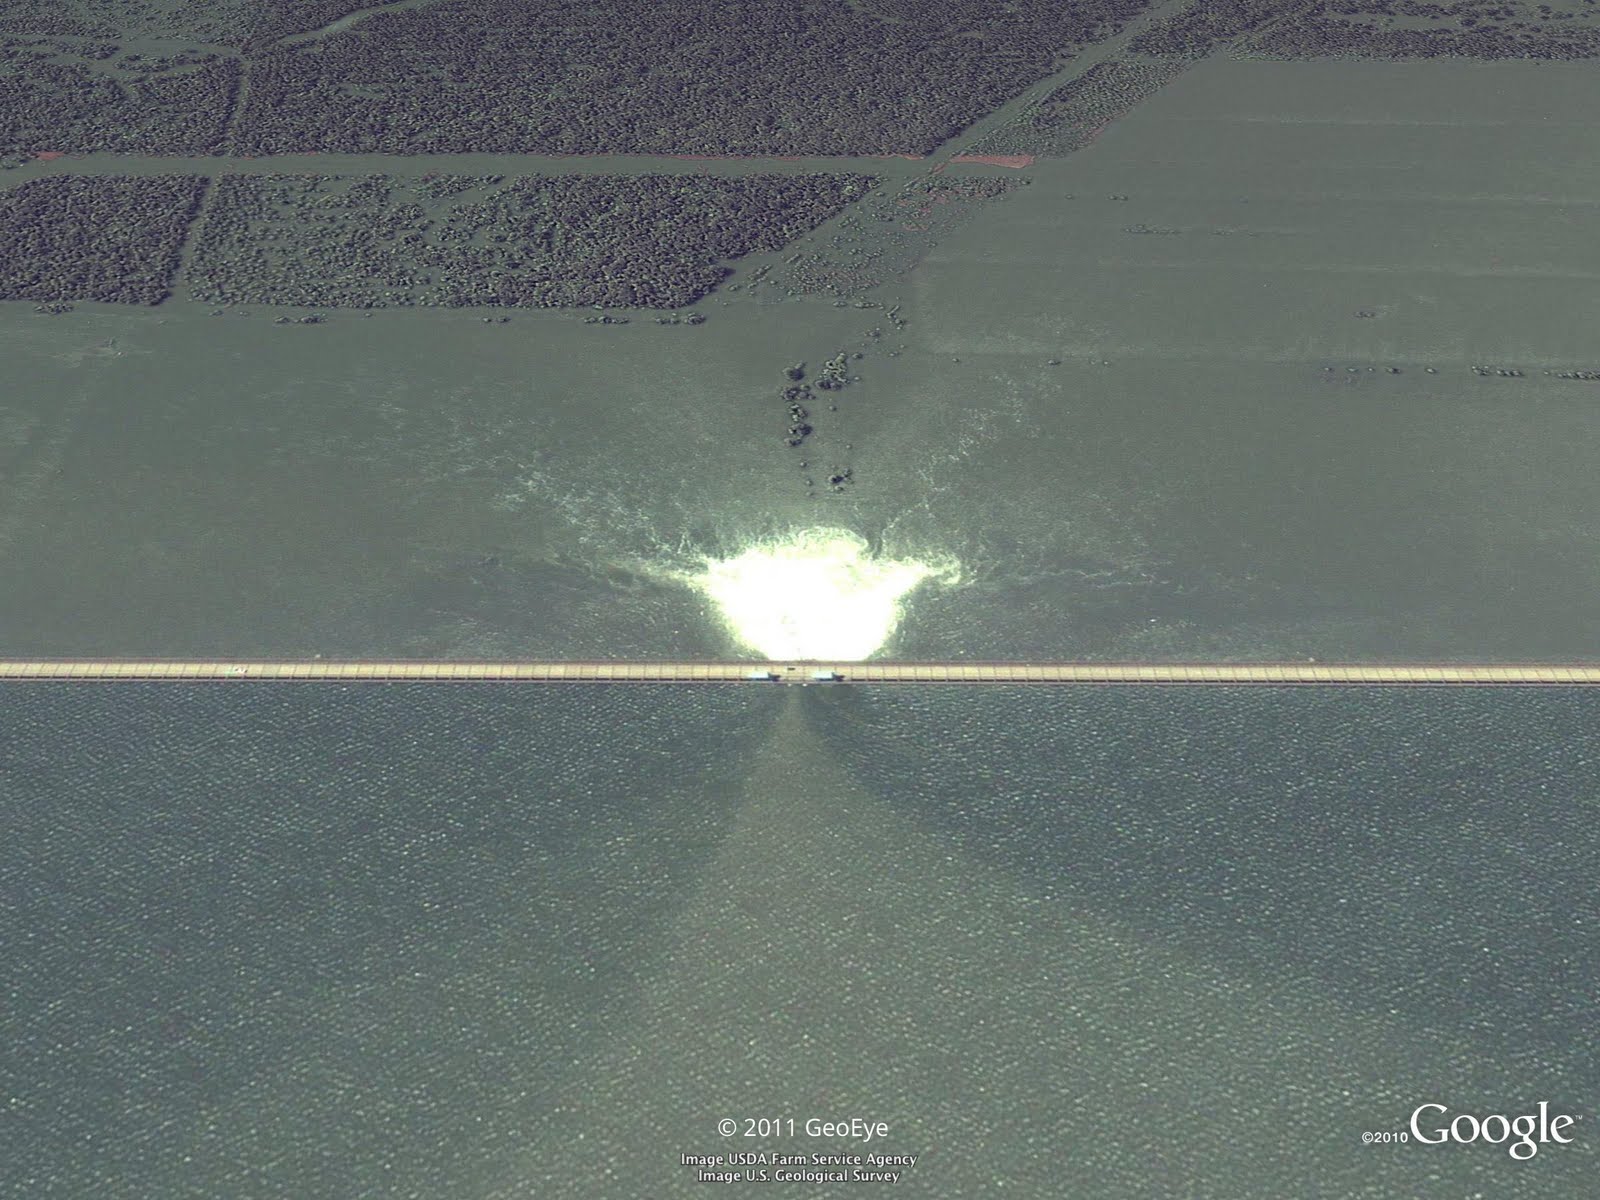
Opened floodgate in Morganza spillway in Louisiana on May 15, 2011. View full-size.
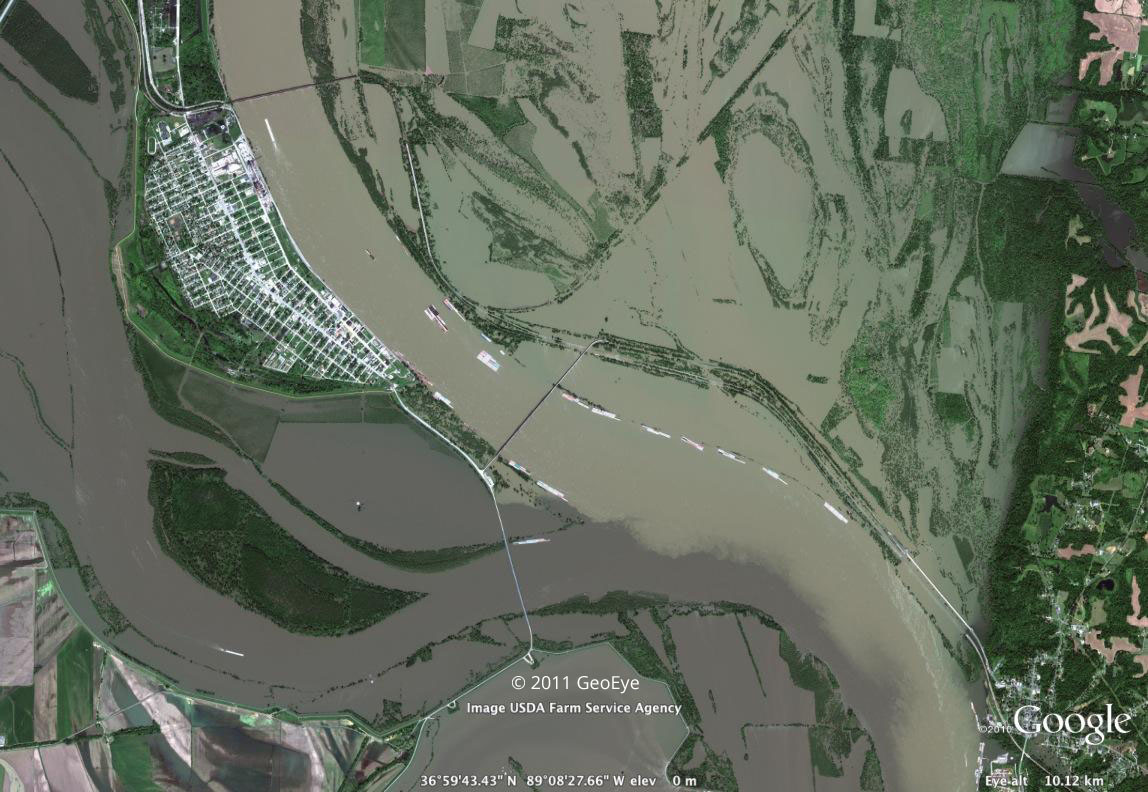
Cairo, Illinois on May 8, 2011. View full-size.
This collection of data is available on Google Maps by searching for “Mississippi flooding.” These data can also be accessed within Google Earth by turning on the ‘Places’ layer and flying to the Mississippi river south of Memphis, TN, or by downloading this kml
Google Places: Access your Places reviews as a feed
 I saw this tweet from Google last night and had a flush of excitement, at least for a second, as I thought that Google had finally solved a perennial problem for SMBs; how to track their reviews in Places.
I immediately rushed over to their post, thinking I would stay up late to write up a report only to find that it wasn’t the long awaited business solution to easily knowing when there was a new Google review for you business. Silly me thinking that Google has solved a long standing problem. Nothing so elegant.
No, it is an RSS feed so that reviewers have a feed of all the reviews they have created and a way of importing more Places via an RSS feed.
Businesses have needed and wanted a solution to the review problem since the introduction of Places pages in 2009.
When was the last time you heard a reviewer ask for an RSS feed of their reviews? Well maybe some reviewer some place did… but then I suggest you follow Google instructions and go find it. Instead of attaching it to the obvious place in your main Google profile or making the existing review list more visible it is is hidden in your Hotpot area.
Google needs to be making local products easier to use, not harder. They need to be making Places a page that a business can’t live without. Hopefully we will see a solution to the review tracking problem some day. In the meantime, one has to wonder whether this type of upgrade is the best way for Google to spend limited local resources.
Note: Getlisted.org and MyReviewsPage.com both offer solutions to this problem that Google should have addressed long ago.
Saturday, May 21, 2011
Did you participate in Google I/O party!
Did you participate in Google I/O last week? Nearly 1 million people did, by attending in person in San Francisco, gathering at dozens of I/O Extended events around the world, or watching the live streamed keynotes and sessions on YouTube.
 Google I/O pushed an enormous amount of information out into the world. Here on this blog, we did our part by publishing many posts about new Google announcements, along with a bunch of guest posts written by developers. Because there were so many posts last week, I figured you might have missed some, so I want to highlight a couple of them here.
In this post, Cameron Henneke writes about his experience developing GQueues Mobile, a task manager app. Cameron discusses the trade-offs developers have to think about when coding for mobile platforms. Should you develop in HTML or go native? What are the advantages to each? How will that choice affect development? What do your users really want? Cameron’s post contains a thorough and candid discussion of his decision-making process.
Another post describes a versatile new technology called near field communication (NFC) and how doubleTwist uses it to share information from one Android device to another. NFC provides a super-low overhead way for two devices to exchange a small amount of data, and doubleTwist’s post not only demonstrates a practical use of NFC in an app, but also provides a lot of sample code to show how they did it.
 Finally, I was pretty busy during Google I/O and I didn’t get to see all the sessions I wanted. Luckily, it’s not too late for anybody to experience more of I/O by watching session videos on YouTube. For my weekend nerd fun, I plan to grab some popcorn and go here. When it’s time to take a break, I can even rock out with Jane's Addiction on the After Hours video. Party!
In this post, Cameron Henneke writes about his experience developing GQueues Mobile, a task manager app. Cameron discusses the trade-offs developers have to think about when coding for mobile platforms. Should you develop in HTML or go native? What are the advantages to each? How will that choice affect development? What do your users really want? Cameron’s post contains a thorough and candid discussion of his decision-making process.
Another post describes a versatile new technology called near field communication (NFC) and how doubleTwist uses it to share information from one Android device to another. NFC provides a super-low overhead way for two devices to exchange a small amount of data, and doubleTwist’s post not only demonstrates a practical use of NFC in an app, but also provides a lot of sample code to show how they did it.
Friday, May 20, 2011
App Engine at I/O 2011
We hope you got a chance to see all of the great sessions on day one and, if you missed our big announcements from yesterday, take a look at all the great features in 1.5.0 including Backends and our plans for App Engine to leave preview later this year.
We’ve got a great set of sessions lined up for day two including updates on our progress with Full-text Search and MapReduce. We’ve also got two great sessions on a subject close to developers’ hearts: reliability.
Under the Covers with the High Replication Datastore - At 10:45 am, we jump into the internals of the High Replication Datastore (HRD), explaining how it works, how it differs from the Master/Slave configuration, and why developers love it. Now that HRD is the default configuration and cheaper to use, come find out what you’re missing.
Life in App Engine Production - At 3:00 pm, come meet the team wearing the pagers so you don’t have to, App Engine’s Site Reliability Engineers (SREs). In this session, they’ll give you a view of what life behind the scenes is like and why you should concentrate on your application and let the SREs take care of keeping the lights on. Learn how building on App Engine means your application gets its very own Devops team.
For those of you that couldn't make it to I/O this year, don’t stress. While we wish you were here, the I/O video team will soon have videos of all our sessions available so you can catch up from the comfort of your own home. We’ve even captured a few of our Developer Sandbox companies so you’ll get the full experience!
Google Storage for Developers open to all
For those of you who have been waiting to use Google Storage, we’re happy to announce that effective immediately, you can get a Google Storage for Developers account without needing to request an invitation.
We’ve also launched several significant enhancements to the service, including more flexible and powerful security features, simplified sharing, the ability to store data in Europe, support for larger objects (up to 5 TB), team-oriented accounts and a completely free promotional tier.
OAuth 2.0 Support
OAuth 2.0 is the new recommended Google Storage authentication and authorization scheme. OAuth 2.0 is an industry standard that we’ve adopted across Google, offering many benefits:
Simplified Sharing
We’re happy to announce that your customers and partners no longer need to sign up for Google Storage in order to be able to access data that you’ve shared with them; you can now share data with anyone who has a Google account.
New Storage Region: Europe
In response to popular demand, effective immediately, we’re adding a new option for data location. You can now choose to store your data in Europe - and get the same high-performance, massively scalable, reliable service as you do when you store your data in the United States.
Regardless of which region you choose, your data will be replicated to multiple geographically diverse Google data centers within the region in order to provide high levels of availability and reliability.
Learn more here.
Team-oriented accounts
Google Storage now uses a team-oriented account model, which allows you to create and manage your account in a more natural way.
We’ve moved to the Google API console for signup and administration, and adopted the same project-based account model that is used by other APIs. After creating a project, you configure billing for it once, and can then add any number of developers to it without requiring them to sign up for separate Google Storage accounts. This means individual developers on a team don’t need to configure billing in order to use Google Storage. This change also makes Google Storage account management consistent with other Google APIs.
Since buckets are now associated with projects rather than individuals, you will need to specify the new
Support for chunked transfer encoding
Google Storage now allows you to upload your data to Google Storage without knowing the object size in advance, using the standard HTTP chunked transfer encoding mechanism. Using this feature, you can stream data into Google Storage instead of buffering it on your own server before sending it to Google.
New API Version
In order to continue to innovate and deliver high-impact features, we’ve found the need to make some backwards-incompatible changes. In order to deliver these features while retaining backwards compatibility for existing code that doesn’t need the new features, we’re introducing a new API version header. The new API version that implements this change is version 2. From version 2 onwards, all API calls will be versioned using the new
Version 2 of the Google Storage API does not support HMAC signature-based authentication. Although we strongly recommend that you move your code to use OAuth 2.0, explicitly specify the project ID when creating and listing buckets and use the new API version header, your existing code will continue to work; if you don’t specify the API version in your request, your requests will still be handled by our old API.
Free Trial Use
Starting right now, all new accounts will receive a monthly free quota of:
The new promotional plan will be effective until Dec 31, 2011. Please note that promotional usage will only apply to a user’s first project that uses Google Storage (for existing users, this is the project that was automatically created for them during the account migration).
If you’re an existing Google Storage for Developers user, thank you for using our product and for your valuable feedback that continues to help us evolve the service to meet your needs. As always, we continue to welcome your feedback in our discussion group. If you haven’t yet tried Google Storage, get your Google Storage account and get started for free today.
We’ve also launched several significant enhancements to the service, including more flexible and powerful security features, simplified sharing, the ability to store data in Europe, support for larger objects (up to 5 TB), team-oriented accounts and a completely free promotional tier.
OAuth 2.0 Support
OAuth 2.0 is the new recommended Google Storage authentication and authorization scheme. OAuth 2.0 is an industry standard that we’ve adopted across Google, offering many benefits:
- Simpler - never sign a request again! OAuth 2.0 uses access tokens for authentication, which obviate the need for complicated signature schemes. We recommend that all OAuth 2.0-authenticated requests be made over SSL.
- More flexible and powerful - OAuth 2.0 allows for three-legged authentication, where a user can grant an application permission to access Google Storage on their behalf (and revoke the grant at any time if necessary).
- Secure
- Your user name and password are used once to create a long-lived (refresh) token which is scoped to allow access to Google Storage o behalf of that account. Your user name and password never needs to live on disk.
- You don’t need to distribute your long-lived credentials to all the servers that need to access Google Storage. Instead, you can manage your long-lived credential centrally, and use it to create short-lived access tokens that you pass to your host cluster. This means that your long-lived tokens are safer.
- You can revoke credentials at any time.
Simplified Sharing
We’re happy to announce that your customers and partners no longer need to sign up for Google Storage in order to be able to access data that you’ve shared with them; you can now share data with anyone who has a Google account.
New Storage Region: Europe
In response to popular demand, effective immediately, we’re adding a new option for data location. You can now choose to store your data in Europe - and get the same high-performance, massively scalable, reliable service as you do when you store your data in the United States.
Regardless of which region you choose, your data will be replicated to multiple geographically diverse Google data centers within the region in order to provide high levels of availability and reliability.
Learn more here.
Team-oriented accounts
Google Storage now uses a team-oriented account model, which allows you to create and manage your account in a more natural way.
We’ve moved to the Google API console for signup and administration, and adopted the same project-based account model that is used by other APIs. After creating a project, you configure billing for it once, and can then add any number of developers to it without requiring them to sign up for separate Google Storage accounts. This means individual developers on a team don’t need to configure billing in order to use Google Storage. This change also makes Google Storage account management consistent with other Google APIs.
Since buckets are now associated with projects rather than individuals, you will need to specify the new
x-goog-project-id header with your list-buckets and create-bucket API calls. However, your existing code will continue to work using your new “default” project that already owns all the buckets you created before we implemented project-based accounts. Learn more about projects and the backwards-compatible default project mechanism here.Support for chunked transfer encoding
Google Storage now allows you to upload your data to Google Storage without knowing the object size in advance, using the standard HTTP chunked transfer encoding mechanism. Using this feature, you can stream data into Google Storage instead of buffering it on your own server before sending it to Google.
New API Version
In order to continue to innovate and deliver high-impact features, we’ve found the need to make some backwards-incompatible changes. In order to deliver these features while retaining backwards compatibility for existing code that doesn’t need the new features, we’re introducing a new API version header. The new API version that implements this change is version 2. From version 2 onwards, all API calls will be versioned using the new
x-goog-api-version header.Version 2 of the Google Storage API does not support HMAC signature-based authentication. Although we strongly recommend that you move your code to use OAuth 2.0, explicitly specify the project ID when creating and listing buckets and use the new API version header, your existing code will continue to work; if you don’t specify the API version in your request, your requests will still be handled by our old API.
Free Trial Use
Starting right now, all new accounts will receive a monthly free quota of:
- 5 GB of free storage,
- 25 GB of free data transfer into Google Storage,
- 25 GB of free data transfer out of Google Storage,
- 2,500 free PUT, POST and LIST requests, and
- 25,000 free GET, HEAD and other requests.
The new promotional plan will be effective until Dec 31, 2011. Please note that promotional usage will only apply to a user’s first project that uses Google Storage (for existing users, this is the project that was automatically created for them during the account migration).
If you’re an existing Google Storage for Developers user, thank you for using our product and for your valuable feedback that continues to help us evolve the service to meet your needs. As always, we continue to welcome your feedback in our discussion group. If you haven’t yet tried Google Storage, get your Google Storage account and get started for free today.
Wednesday, May 18, 2011
Introducing CityHash
We’re pleased to announce the new CityHash family of hash functions for strings. We’re releasing two functions today: CityHash64 and CityHash128. They hash strings to 64- and 128-bit hash codes, respectively. These functions aren’t suitable for cryptography, but our experience so far shows that they’re great for, say, hash tables.
We tried to optimize for CPUs that are common in Google’s datacenters, but it turns out that most PCs and laptops have the relevant features as well. The important ones are 64-bit registers, instruction-level parallelism, and fast unaligned memory accesses.
We were greatly inspired by previous work on hashing, especially Austin Appleby’s MurmurHash. The key advantage of our approach is that most steps contain at least two independent mathematical operations. Modern CPUs tend to perform best with this type of code.
The disadvantage of our approach is that the code is more complicated than most popular alternatives. We decided to optimize for speed rather than simplicity and even included special cases for short inputs.
Overall, we believe that CityHash64 and CityHash128 are exciting new ways to solve a classic problem. Under real-life conditions we expect CityHash64 to outperform previous work by at least 30% in speed, and perhaps as much as a factor of two. Also, as far as we know, these functions’ statistical properties are sound. Please don’t hesitate to try this fast new code!
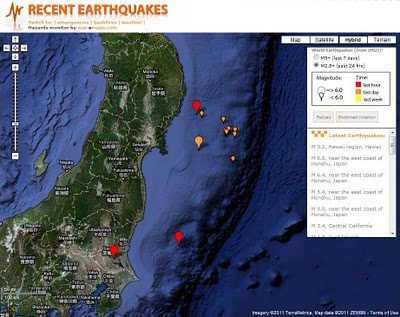
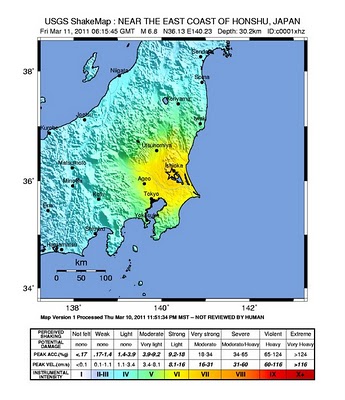
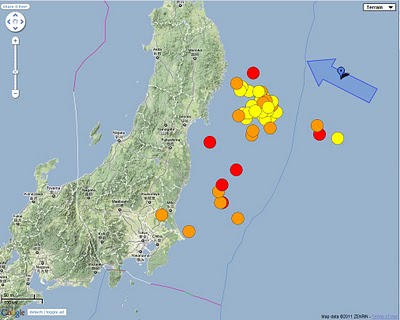
Japan hit by massive earthquakes
News is just coming in about a series of earthquakes in Japan, the largest measuring 8.9, near the east coast of Honshu and potentially triggering tsunami with waves up to 6 meters high. There was another one measuring 6.8 north of Tokyo and some more further afield.
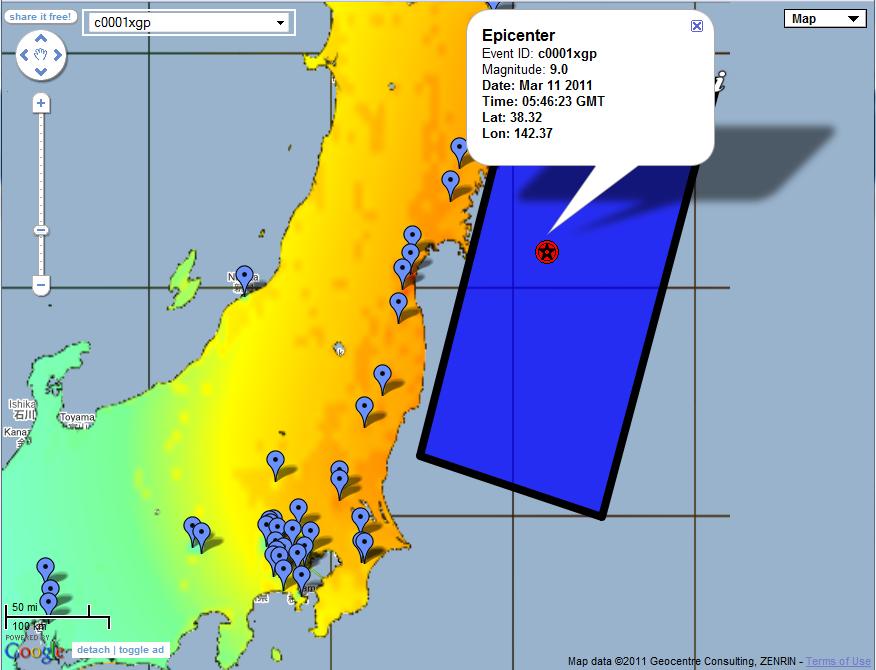
 [Official USGS kmz feed on a map that can be shared]
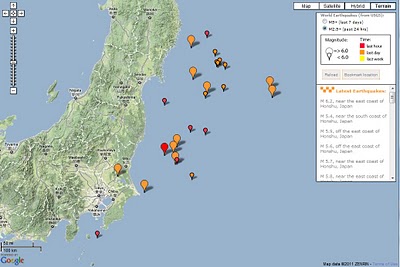 [Many aftershocks happening as shown on this map]
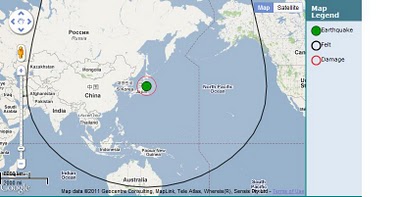 [Gescience Australia estimates of felt and damage radius]
 [Tsumami warning from Japan Meteorological Agency]
Update: It has been 4 days after the event but the tragedy is not over yet… thousands of people still missing, regional areas running out of water, food petrol and survivors threatened by radiation from damaged nuclear power plants… Simply no words to express adequately the sadness and my sympathy to all those affected by the earthquake and the resulting tsunami.
The world’s GIS community has contributed a lot of resources to depicts the events on the maps for all those searching details on the event. A few examples are presented below for information.
Links to more maps:
Google Crisis Response
Animated timeline: main earthquake and aftershocks (in HTML5)
New York Times: Tsunami propagation map
New York Times: Interactive maps with counts of dead and missing persons, building damage
Washington Post: Earthquake in Japan interactive map
New York Times: Forecast for Plume's Path
 [Official USGS kmz feed on a map that can be shared]
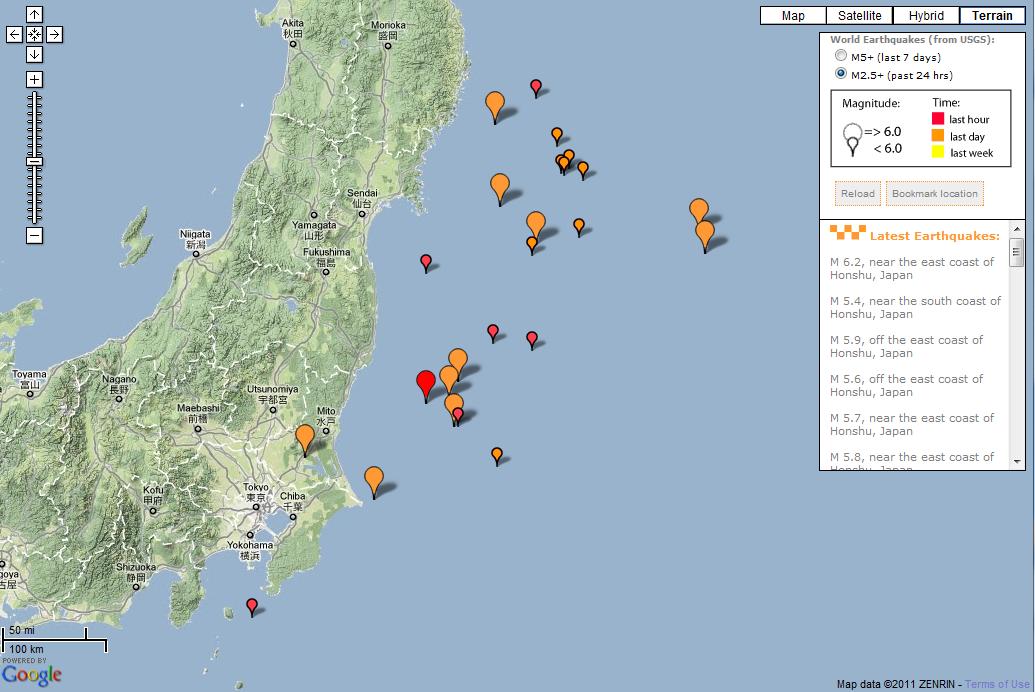 [Many aftershocks happening as shown on this map]
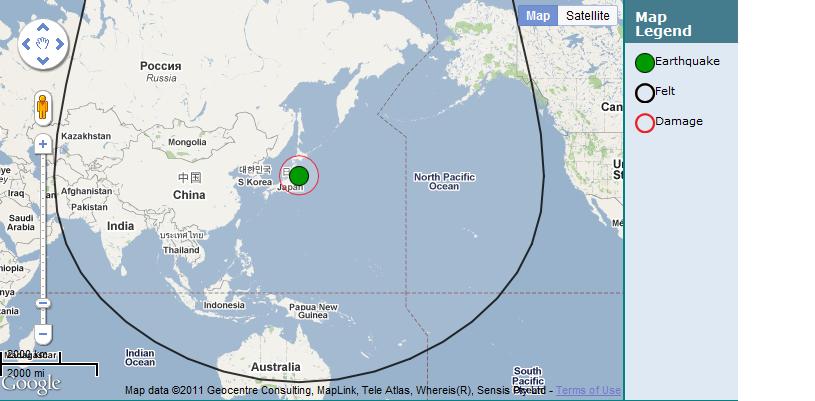 [Gescience Australia estimates of felt and damage radius]
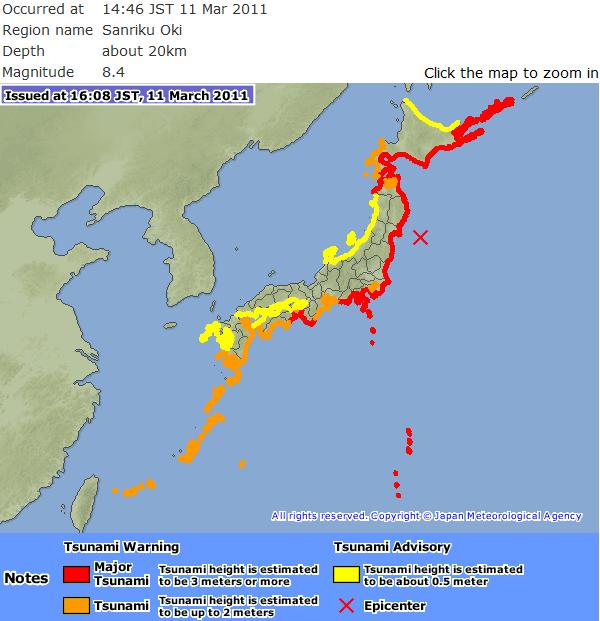 [Tsumami warning from Japan Meteorological Agency]
Update: It has been 4 days after the event but the tragedy is not over yet… thousands of people still missing, regional areas running out of water, food petrol and survivors threatened by radiation from damaged nuclear power plants… Simply no words to express adequately the sadness and my sympathy to all those affected by the earthquake and the resulting tsunami.
The world’s GIS community has contributed a lot of resources to depicts the events on the maps for all those searching details on the event. A few examples are presented below for information.
Links to more maps:
Google Crisis Response
Animated timeline: main earthquake and aftershocks (in HTML5)
New York Times: Tsunami propagation map
New York Times: Interactive maps with counts of dead and missing persons, building damage
Washington Post: Earthquake in Japan interactive map
New York Times: Forecast for Plume's Path
Tuesday, May 17, 2011
OpenLayers 2.10 – A Beginner’s Guide Book Review
 I was excited to be able to review a book on what I think is one of my favorite javascript libraries out there. OpenLayers 2.10 Beginner’s Guide has some really good parts and is going to be a good resource for those who want to get started with OpenLayers. There are some major typos and other formatting issues with the ePub version I have that may not be present in the print version (I’m so over killing trees), but prepare to be frustrated if you go the ePub route.
One section of the book that I did think was very valuable was the one on Firebug. It is a good reminder that developing JavaScript applications with only your web browser and notepad is not generally going to be enough.
If you have any experience, this book is probably going to not be of much value as it really is a beginners guide. Developers can probably get up and running quicker using the online docs and examples than this book. That said, it could be a good introduction to anyone wanting to get started with online mapping APIs. A sample chapter is available if you’d like to see if this book is for you.
If there is one thing you can say about the Geo/LI space is that we’ve got a great selection of books to pick from lately. This OpenLayers book is probably no exception to those wanting an integration to OpenLayers. People always ask me what “technology” should they learn and I usually say OpenLayers. If you are the type that likes a book to help them learn how to do something, I’m going to say OpenLayers 2.10 – A Beginner’s Guide is a good choice to get your head around OpenLayers.
Exploring space with Google
At Google, we’re never afraid to think big, and our mission to organize the world's information and make it universally accessible and useful doesn't stop at our exosphere. The universe is full of information, and as we push the boundaries of exploration, our job will be to organize it and make it searchable.
It shouldn’t come as a surprise to anyone out there that we have a passion for space. Google’s culture of innovation stems from our pioneering quest for knowledge; each one of us is empowered to think differently, break the limits, and take intelligent risks. Googlers are scientists, engineers, technologists, space enthusiasts; I have yet to meet a Googler who didn’t share the spirit of exploration.
In partnership with NASA, and PBS, YouTube and Google Moderator will pose your questions to the crew of STS-134, the final mission of the space Shuttle Endeavour, in a live interview emceed by stellar talent (another space joke!) Miles O'Brien.
To mark the occasion, we put together this video to celebrate our love for space, told with the help of products we pour our hearts into every day. You’ll see everything from historical sky maps featured in Google Earth, to 3D buildings at Kennedy Space Center, and our salute to both the astounding achievement of the Apollo era and the Google Lunar X PRIZE, a new space race of entrepreneurial leadership.
With our main campus less than a mile away from the NASA Ames Research Center, it seemed natural that our organizations should strike up a relationship and find ways to work together. Over the years, we have collaborated with our NASA colleagues on some amazing projects, and are very proud of the joint work and collaboration that have contributed to our space products, such as Moon and Mars in Google Earth. Most importantly, the longstanding friendship between our organizations means we can use our skills to complement each other, and bring people together around the globe. Literally. When we say around the globe, we mean....around the globe. With an altitude of roughly 200 miles, and orbiting at about 17,500 miles per hour! (I crack myself up with my space jokes.)
We hope you love the video as much as we do; it's our way of making space exploration open and accessible to everyone. Happy viewing, and keep exploring!
Monday, May 16, 2011
The WeatherSpark
WeatherSpark Beta- Historical weather patterns visualised
An excellent Google maps mashup -an early contender for best gmap 2011.

"WeatherSpark is a pretty amazing Google Map of current and historical weather conditions. The site lets you view the historical records of over 4,000 weather stations."
example above
http://weatherspark.com/#!graphs;ws=28726;t=321909;mspp=37115493
Climate Patterns

If you are more interested in today's weather you can just center the map on your location and view the current temperature and the current precipitation radar
http://weatherspark.com/#
2011 imagery of bin Laden's compound in Google Earth
While Google Earth only shows the 2005 imagery of Osama bin Laden's compound, Stefan Geens at Ogle Earth discovered some DigitalGlobe imagery of the area that was captured in mid-January of this year!
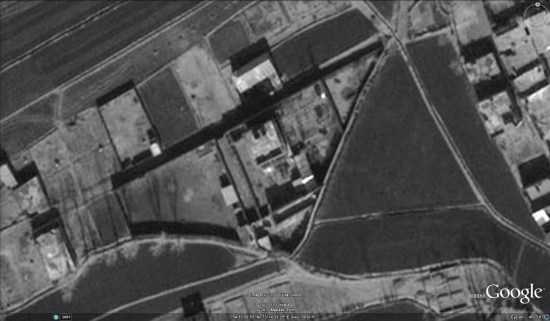
The imagery can be viewed via DigitalGlobe's Flickr account, or by loading this 6MB KMZ file. Stefan has added a yellow outline of the compound so that it's easier to find, but you can turn that off for a better look at it.
Stefan has been going a great job of keeping up with the latest developments today, so be sure to keep up with Ogle Earth for his latest discoveries.
The imagery can be viewed via DigitalGlobe's Flickr account, or by loading this 6MB KMZ file
. Stefan has added a yellow outline of the compound so that it's easier to find, but you can turn that off for a better look at it.Stefan has been going a great job of keeping up with the latest developments today, so be sure to keep up with Ogle Earth for his latest discoveries.
Wednesday, May 11, 2011
Android & App Engine
Imagine this: you've spent the past few months hammering away at the latest mobile game sensation, Mystified Birds, and you are one level away from complete mastery. And then it happens. In a fit of excitement you throw your hands up, and along with them your Nexus S, which settles nicely at the bottom of the pool you happen to be relaxing next to. The phone is rendered useless. Luckily, your insurance policy covers the replacing the device and the Android Market handles replacing your apps. Unluckily though, all of your Mystified Birds data went the way of your device, leaving you to start from scratch.
Wouldn't it be great if your new device not only contained all of your apps, but all of your valuable data as well? We think so. With Google Plugin for Eclipse (GPE) v2.4 it's much easier to build native Android apps that can take data with them wherever they go. And there's no better place to host your backend service and store your data than Google's cloud service, App Engine.
With the latest release of GPE, we're bringing together these two great Google platforms, Android and App Engine, with a set of easy-to-use developer tools. Diving a bit deeper, here are some of the features offered in GPE 2.4:
Project Creation
With GPE 2.4, you now have the ability to create App Engine-connected Android projects. This new Eclipse project wizard generates fully functioning Android and GWT clients that are capable of talking to the same App Engine backend using the same RPC code and business logic.
Cloud to Device Messaging Support
Polling for backend changes on a mobile device is inefficient and will result in poor app performance and battery drain. As a solution for Android developers, the Android team built Cloud to Device Messaging (C2DM), a service for sending lightweight pings to notify apps when they have pending data. We heard back from developers that integrating with C2DM results in a lot of boilerplate (and sometimes fragile) code that they would rather not maintain. With the 2.4 release of GPE, when you create a new App Engine connected Android project, you'll get this code for free. All you have to do is hook up the app-specific code to customize the handling of the C2DM notification.
RPC Generation and Tooling
Writing and maintaining RPC code (code that allows your app to communicate with backend servers) is monotonous and error prone. Let's face it, you're a mobile developer and the last thing you want to be spending time on is writing (or debugging) this type of code. In GPE 2.4 we're introducing tooling that removes this task for you, and will generate all of the underlying RPC boilerplate code within a few clicks. You specify the model objects that will be used between client and server, and GPE generates the RPC service, DTOs, and client-side calling code. To make this even better, the generated code works across Android and GWT apps, so any future changes that you make will only need to be made once.
Want to get started? Download GPE 2.4 Beta here. Note that you'll need to install the Android Developer Tools (ADT) plugin as a prerequisite, which can be found here.
If you have any feedback, we'd love to hear it and the GPE Group is the right place to submit it. The App Engine and Android Developer Groups are also great sources of information.
Tuesday, May 10, 2011
Google I/O: Mojo Helpdesk
Mojo Helpdesk from Metadot is an RDBMS-based Rails application for ticket tracking and management that can handle millions of tickets. We are migrating this application to run on Google App Engine (GAE), Java, and Google Web Toolkit (GWT). We were motivated to make this move because of the application’s need for scalability in data management and request handling, the benefits from access to GAE’s services and administrative tools, and GWT’s support for easy development of a rich application front-end.
In this post, we focus on GAE and share some techniques that have been useful in the migration process.
Task failure management
Our application makes heavy use of the Task Queue service, and must detect and manage tasks that are being retried multiple times but aren’t succeeding. To do this, we extended
This allows permanent task failure to be reliably exposed as an application-level event, and handled appropriately. (Similar techniques could be used to extend the new official Deferred API).
Appengine-mapreduce
Mojo Helpdesk needs to run many types of batch jobs, and
Supporting transaction semantics
The Datastore supports transactions only on entities in the same entity group. Often, operations on multiple entities must be performed atomically, but grouping is infeasible due to the contention that would result. We make heavy use of transactional tasks to circumvent this restriction. (If a task is launched within a transaction, it will be run if and only if the transaction commits). A group of activities performed in this manner – the initiating method and its transactional tasks – can be viewed as a “transactional unit” with shared semantics.
We have made this concept explicit by creating a framework to support definition, invocation, and automatic logging of transactional units. (The
Entity Design
To support join-like functionality, we can exploit multi-valued Entity properties (list properties) and the query support they provide. For example, a
In this post, we focus on GAE and share some techniques that have been useful in the migration process.
Task failure management
Our application makes heavy use of the Task Queue service, and must detect and manage tasks that are being retried multiple times but aren’t succeeding. To do this, we extended
Deferred, which allows easy task definition and deployment. We defined a new Task abstraction, which implements an extended Deferrable and requires that every Task implement an onFailure method. Our extension of Deferred then terminates a Task permanently if it exceeds a threshold on retries, and calls its onFailure method.This allows permanent task failure to be reliably exposed as an application-level event, and handled appropriately. (Similar techniques could be used to extend the new official Deferred API).
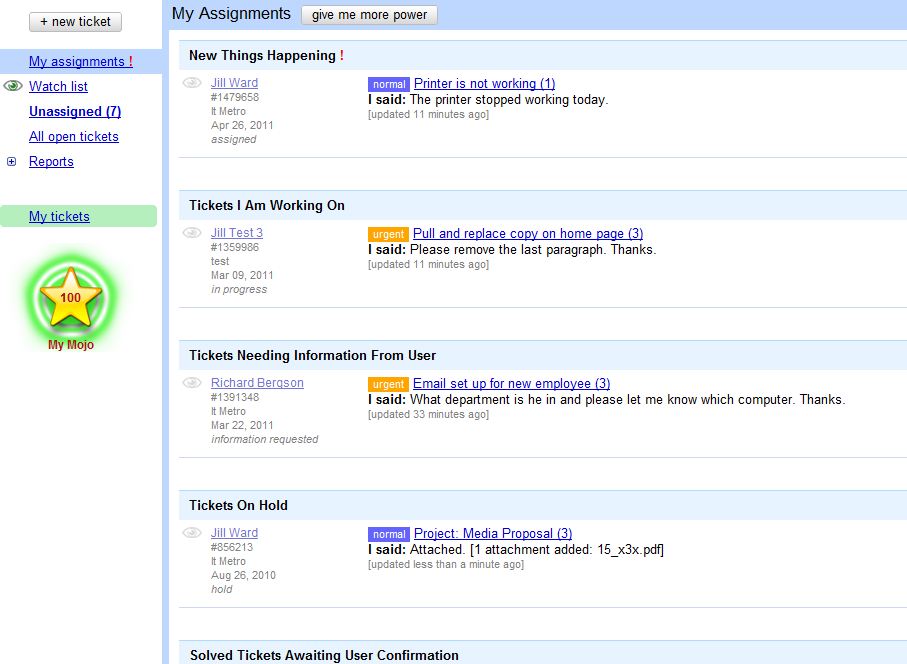 |
| From the existing Mojo Helpdesk: a view of a user’s assigned tickets. |
Mojo Helpdesk needs to run many types of batch jobs, and
appengine-mapreduce is of great utility. However, we often want to map over a filtered subset of Datastore entities, and our map implementations are JDO-based (to enforce consistent application semantics), so we don’t need low-level Entities prefetched.
So, we made two extensions to the mapper libraries. First, we support the specification of filters on the mapper’s Datastore sharding and fetch queries, so that a job need not iterate over all the entities of a Kind. Second, our mapper fetch does a keys-only Datastore query; only the keys are provided to the map method, then the full data objects are obtained via JDO. These changes let us run large JDO-based mapreduce jobs with much greater efficiency.Supporting transaction semantics
The Datastore supports transactions only on entities in the same entity group. Often, operations on multiple entities must be performed atomically, but grouping is infeasible due to the contention that would result. We make heavy use of transactional tasks to circumvent this restriction. (If a task is launched within a transaction, it will be run if and only if the transaction commits). A group of activities performed in this manner – the initiating method and its transactional tasks – can be viewed as a “transactional unit” with shared semantics.
We have made this concept explicit by creating a framework to support definition, invocation, and automatic logging of transactional units. (The
Task abstraction above is used to identify cases where a transactional task does not succeed). All Datastore-related application actions – both in RPC methods and "offline" activities like mapreduce – use this framework. This approach has helped to make our application robust, by enforcing application-wide consistency in transaction semantics, and in the process, standardizing the events and logging which feed the app’s workflow systems.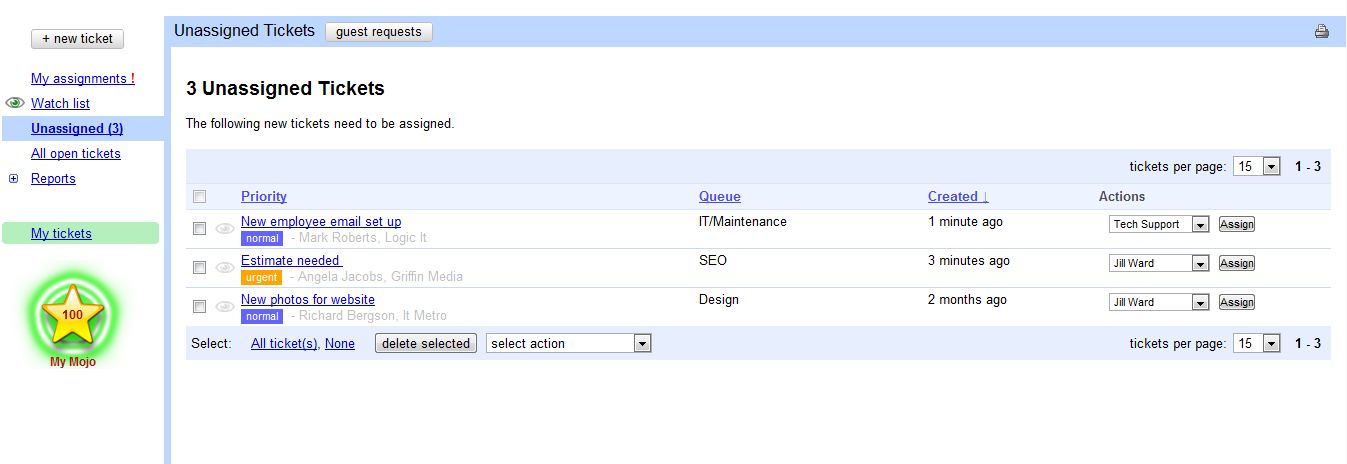 |
| From the existing Mojo Helpdesk: a view of the unassigned tickets for a work group. |
To support join-like functionality, we can exploit multi-valued Entity properties (list properties) and the query support they provide. For example, a
Ticket includes a list of associated Tag IDs, and Tag objects include a list of Ticket IDs they’re used with. This lets us very efficiently fetch, for example, all Tickets tagged with a conjunction of keywords, or any Tags that a set of tickets has in common. (We have found the use of "index entities" to be effective in this context). We also store derived counts and categorizations in order to sidestep Datastore restrictions on query formulation.
30% of all Restaurant Queries on Google Are Mobile
In a very good online webinar that Google offered called Are You Mobile Ready? they shared some interesting internal data on the percentage of mobile queries. The charts show the % of mobile queries to total search queries from January 2007 through January of this year. Previously Bing had noted that as many as 50% of all restaurant queries are mobile.
In Google’s data the % of mobile queries as a % of total queries range from 15% in the insurance industry to almost 30% in restaurants. It is interesting but not surprising that Christmas peaks are obvious in the consumer electronics chart.
Click to view larger:


In Google’s data the % of mobile queries as a % of total queries range from 15% in the insurance industry to almost 30% in restaurants. It is interesting but not surprising that Christmas peaks are obvious in the consumer electronics chart.
Click to view larger:


Monday, May 9, 2011
Is it true that 3D suck?
I was on a road trip holiday the week before last and before I left I read this James Fee blog post he has an image of Godzilla walking into electricity pylons with the tag line 'Google Earth keeps bumping into things trying to work out why it is here'. This led me to ruminate and I quickly wandered from James' post about GEarth enterprise to the more general 'what is Google Earth good for?'. I considered features such as
- layer control
- zooming
- time animation
Current Uses of 3D. I don't have much time for fancy graphics, so beyond cool looking 3D flights, what does 3D in Google Earth actually add to understanding at the moment? There are several examples:
- 3D buildings: Populating a city with 3D models adds a lot of value to urban geography, you can see what a skyline looks like or enhance what you've seen on a walk through a foreign city by revisiting your walk in GEarth later. 3D trees are available in GEarth too but I don't think they're nearly as useful as the buildings.
- Mountains and Valleys: When considering topics where topography is important a 3D view can add understanding. The Appalachian Mountain removal project is a perfect example as the location of the mines on the tops of the mountains is key to understanding the problem.
- Earth Science Models: 3D models of large scale processes on our planet such as subducting plate margins and hurricanes can add understanding, see the project I'm working on with Old Dominion University and others.
- Streetview and Panoramas: Streetview and gigapan panoramas come close to giving a realistic 3D view of a scene. Streetview enables you to move from location to location whilst a gigapan allows you to zoom in on interesting features of the panorama.
IMHO the Streetview/Panorama example is the most important of these. However, the 3D visualisations discussed above are far less common on the web than the uses of 2D like data mashups, real time maps and map related infographics.
Future Uses of 3D: But what is available now may not be the whole story. Can we imagine a use for 3D in the future that is the 'killer app?'. Here's some possible future uses:
- Real 3D Earth Science Models: Currently the way to present a 3D geology model is to slide it out of the ground to give the viewer the idea that its come from underground. It works pretty well but it would be good to be able to fly beneath the earth's surface and show models in their real situation.
- Thematic 3D data: I've frequently discussed 3D thematic maps on this blog, mostly unfavourably. However, the 'Obama: One People' visualisation I discuss here looks to me like it really adds something, I think 3D thematic maps could be useful visualisations but they remain unproven - no one has done user tests on them.
I can foresee that Streetview and similar panoramas will improve in time with real time 360 views and developments like Microsoft's streetslide helping make them more usable. Beyond that, neither of the topic areas listed above is convincing as a killer app.
2D Dominance: So I don't think 3D is ever going to topple 2D as the best way to visualise spatial data. This may seem a little surprising, we live, work and move about in 3D all the time, why won't 3D will become more common? What this point misses is that we also symbolise all the time too, a road map is far more useful than satellite imagery for navigating with because it strips out everything unnecessary (trees, people, greenhouses) and leaves exactly the information we need: roads and junctions as symbols. Usually the best visualisation is the simplest one possible so if a spatial problem can be visualised in 2D its best to do it that way. Especially if you are rendering the map on a small screen smart phone. We live on a planet that were it reduced to the size of a billiard ball would be smoother than any in the world so it really isn't surprising that most of our spatial data can be effectively reduced to 2D.
*of course you can now pull 3D GEarth into a Google Maps but I'm not really focussing on the technology here.
Sunday, May 8, 2011
Strange map: The Furniture District
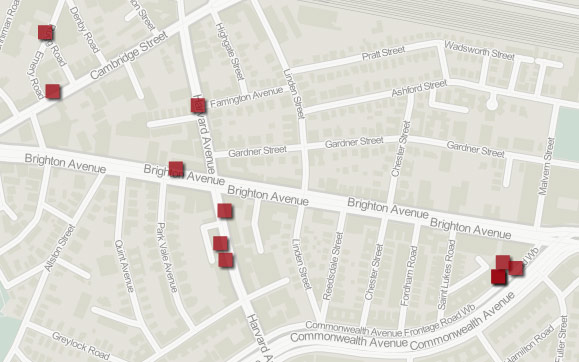
Over on the Bostonography Blog, Andy is muses about the spatial arrangement of humorous retailers in Cambridge. It’s inspired by The Simpsons and has some great looking maps (like the above) from GeoCommons.
Saturday, May 7, 2011
Google Earth in stereo 3D
Nearly five years ago, Frank first told you about the TriDef Visualizer, which allows you to explore Google Earth in true 3D stereo with anaglyph glasses.
TriDef has recently released version 4.5 of their product which can do some fun stuff with Google Earth, so I decided to give it a try.
The Good
• 14 day fully functional trial version.
• Only requires normal anaglyph glasses (very inexpensive).
• Works in all modes of Google Earth, including Street View.

The Bad
• Being anaglyphic 3D, it's not as sharp as what you see in new 3D movies.
• It simply refuses to work if you have multiple monitors on your system. Rather than mess with those settings, I ran it on my laptop instead.
That being said, it's worth giving it a shot. If you need to get some glasses, you can find them on Amazon for virtually nothing and then go download the 14-day free trial of TriDef.
TriDef has recently released version 4.5 of their product which can do some fun stuff with Google Earth, so I decided to give it a try.
The Good
• 14 day fully functional trial version.
• Only requires normal anaglyph glasses (very inexpensive).
• Works in all modes of Google Earth, including Street View.
The Bad
• Being anaglyphic 3D, it's not as sharp as what you see in new 3D movies.
• It simply refuses to work if you have multiple monitors on your system. Rather than mess with those settings, I ran it on my laptop instead.
That being said, it's worth giving it a shot. If you need to get some glasses, you can find them on Amazon for virtually nothing and then go download the 14-day free trial of TriDef.
The Future of Shopping?

The MIT Technology review put up a video about an iPhone app created by Modiv Media that lets grocery store customers “scan items while they shop, presents them with personalized offers as they go, and speeds up their checkout” by transmitting the completed order to the register. The app and system is currently being deployed by the supermarket chain Stop & Shop at its 375 stores in the North East.
From the Modiv Media site: “From check-in to check-out, they expect a seamless experience that provides them value. Value that is delivered through personalized offers, the ability to shop and scan with their smartphone and self-checkout that’s fast and without waiting in line. And, in return, they’ll spend more, 10% – 17% more.”
The MIT article noted:
The app uses data from the loyalty card to present offers based on the user’s past purchases and current location in the store. It works in addition to the existing loyalty program, offering savings on top of the deals already advertised on store shelves.
When the user has finished shopping, the app sends information about the contents of the shopping cart to the store’s point-of-sale system. The user can go to any register, scan the loyalty card, and pay for the order.
Modiv Mobile provides retailers with a white-labeled platform on which to build a personalized shopping app that is integrated with your POS and targets offers based on data from your loyalty program or customer data.
New cities and better coverage in Building Maker
If you climb up on the roof of your house and cup your hands to your ears, I’ll bet you’ll hear cheering. That’s the sound of everyone in Fresno, Lake Tahoe, Austin, Phoenix, Sacramento, San Diego and St. Louis celebrating the arrival of better Building Maker coverage in their cities. Touching, no?
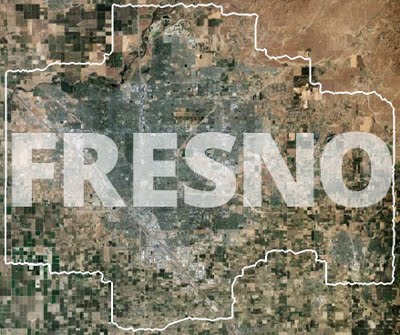
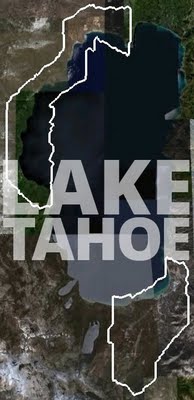
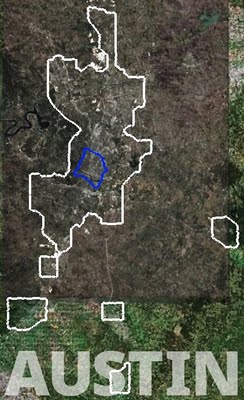
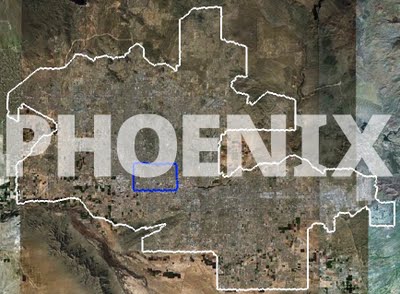
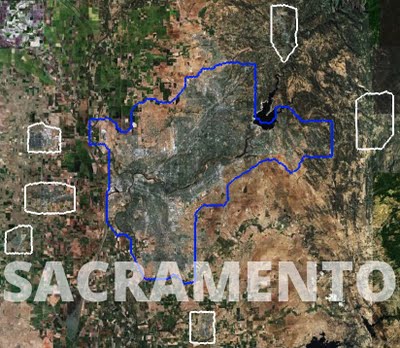
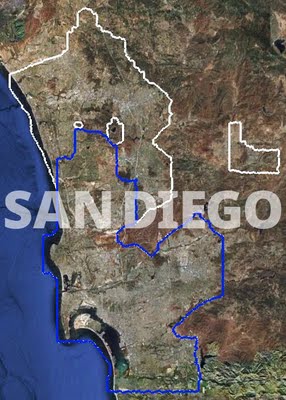
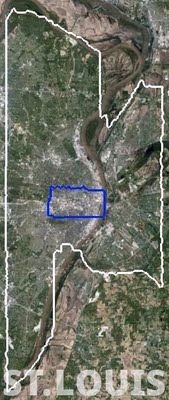 White outline shows current coverage area; blue indicates previous boundary.Learn all about Google Building Maker (the coolest dedicated geo-modeling tool around) and give it a whirl when you’re ready. 116 cities so far!

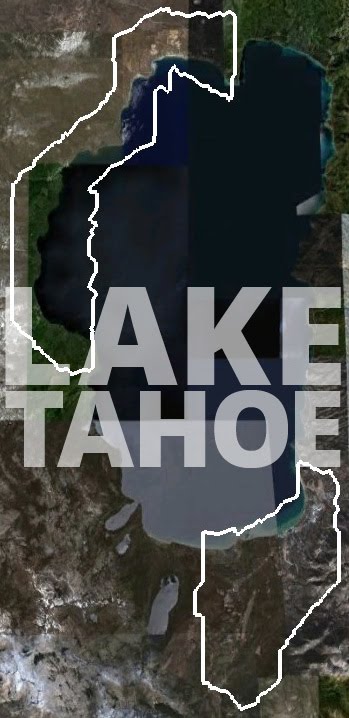
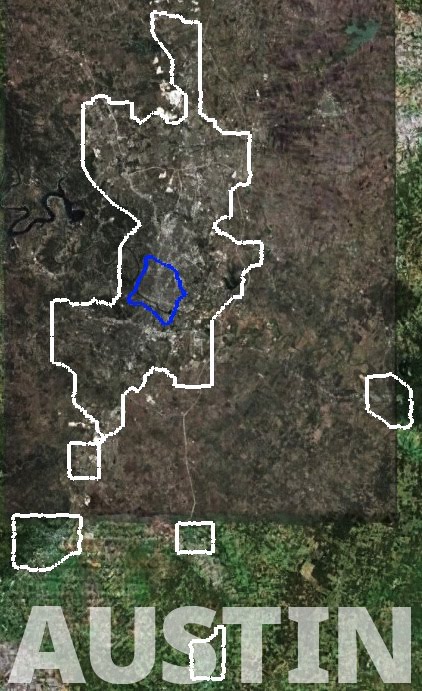


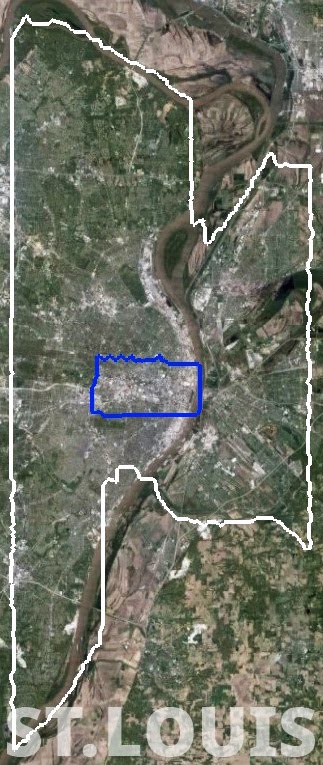 White outline shows current coverage area; blue indicates previous boundary.
Subscribe to:
Comments (Atom)