There’s plenty of information on the ‘net describing how to import spatial data from ESRI shapefiles into SQL Server . However, what I haven’t seen any examples of yet is how to do the reverse: taking geometry or geography data
from SQL Server and dumping it
into an ESRI shapefile.
There’s plenty of reasons why you might want to do this – despite its age and relative limitations (such as the maximum filesize per file, limited fieldname length, the fact that each file can contain only a single homogenous type of geometry, etc…), the ESRI shapefile format is still largely the industry standard and pretty much universally read by all spatial applications. Recently, I needed to export some data from SQL Server to shapefile format so that it could be rendered as a map in
mapnik, for example (which, sadly, still can’t directly connect to a MS SQL Server database).
So, here’s a step-by-step guide, including the pitfalls to avoid along the way.
Setup
To start with, make sure you’ve got a copy of OGR2OGR version 1.8 or greater (earlier versions do not have the MSSQL driver installed). You can either build it from source supplied on the
GDAL page or, for convenience, download and install pre-compiled windows binaries supplied as part of the
OSgeo4W package.
Now, let’s set up some test data in a SQL Server table that we want to export. To test the full range of OGR2OGR features (or should that say, “the full range of error messages you can create”?), I’m going to create a table that contains two different geometry columns – an original geometry and a buffered geometry, populated using a range of different geometry types:
CREATE TABLE OGRExportTestTable (
  shapeid int identity(1,1),
  shapename varchar(32),
  shapegeom geometry,
  bufferedshape AS shapegeom.STBuffer(1),
  bufferedshapearea AS shapegeom.STBuffer(1).STArea()
);

INSERT INTO OGRExportTestTable (shapename, shapegeom) VALUES
('Point #1', geometry::STGeomFromText('POINT(13 10)', 2199)),
('Point #2', geometry::STGeomFromText('POINT(7 12)', 2199)),
('Line #1', geometry::STGeomFromText('LINESTRING(0 0, 8 4)', 2199)),
('Polygon #1', geometry::STGeomFromText('POLYGON((2 2, 4 2, 4 4, 2 4, 2 2))', 2199)),
('Line #2', geometry::STGeomFromText('LINESTRING(0 10, 10 10)', 2199));
Here’s what the contents of this table looks like in the SSMS Spatial Results tab:

Exporting from SQL Server to Shapefile with OGR2OGR (via a string of errors along the way)
The basic pattern for OGR2OGR usage is given at
http://www.gdal.org/ogr2ogr.html, with additional usage options for the SQL Server driver at
http://www.gdal.org/ogr/drv_mssqlspatial.html. So, let’s start by just trying out a basic example to export the entire OGRExportTestTable from my local SQLExpress instance to a shapefile at c:tempsqlexport.shp, as follows: (change the connection string to match your server/credentials as appropriate)
ogr2ogr -f "ESRI Shapefile" "C:tempsqlexport.shp"
"MSSQL:server=localhostsqlexpress;database=tempdb;tables=OGRExportTestTable;trusted_connection=yes;"
This will fail with a couple of errors, but the first one to address is as follows:
ERROR 1: Attempt to write non-point (LINESTRING) geometry to point shapefile.
SQL Server will allow you to mix different types of geometry (Points, LineStrings, Polygons) within a single column of geometry or geography data. An ESRI shapefile, in contrast, can only contain a single homogenous type of geometry. To correct this, rather than trying to dump the entire table by specifying the
tables=OGRExportTable in the connection string, we’ll have to manually select rows of only a certain type of geometry at a time by specifying an explicit SQL statement. Let’s start off by concentrating on the points only. This can be done with the
–sql option, as follows:
ogr2ogr -f "ESRI Shapefile" "C:tempsqlexport.shp"
"MSSQL:server=localhostsqlexpress;database=tempdb;trusted_connection=yes;"
-sql "SELECT * FROM OGRExportTestTable WHERE shapegeom.STGeometryType() = 'POINT'"
This time, a new error occurs:
ERROR 1: C:tempsqlexport.shp is not a directory.
ESRI Shapefile driver failed to create C:tempsqlexport.shp
Although our first attempt to export the entire table failed, it still created an output file at C:tempsqlexport.shp. Seeing as we didn’t specify the behaviour for what to do when the output file already exists, when we run OGR2OGR for the second time it has now errored. To correct this, we’ll add the
–overwrite flag.
ogr2ogr -f "ESRI Shapefile" "C:tempsqlexport.shp"
"MSSQL:server=localhostsqlexpress;database=tempdb;trusted_connection=yes;"
-sql "SELECT * FROM OGRExportTestTable WHERE shapegeom.STGeometryType() = 'POINT'"
-overwrite
Running again and the error is now:
ERROR 6: Can’t create fields of type Binary on shapefile layers.
Ok, so remember that our original shapefile had
two geometry columns. When you create a shapefile, one column is used to populate the shape information itself, while every other column becomes an attribute of that shape, stored in the associated .dbf file. Since the remaining geometry column is a binary value, this can’t be stored in the .dbf file. To resolve this, rather than using a SELECT *, we’ll explicitly specify each column to be included in the shapefile. You could, if you want, then omit the second geometry column completely from the list of selected fields. Instead, I’ll use the ToString() method to convert it to WKT, which
can then be stored as an attribute value:
ogr2ogr -f "ESRI Shapefile" "C:tempsqlexport.shp"
"MSSQL:server=localhostsqlexpress;database=tempdb;trusted_connection=yes;"
-sql "SELECT shapeid, shapename, shapegeom, bufferedshape.ToString(), bufferedshapearea  FROM OGRExportTestTable WHERE shapegeom.STGeometryType() = 'POINT'"
-overwrite
This should now run without errors, although you’ll still get a warning:
Warning 6: Normalized/laundered field name: ‘bufferedshapearea’ to bufferedsh
The names of any attribute fields associated with a shapefile can only be up to a maximum of 10 characters in length. In this case, OGR2OGR has manually truncated the name of the buferedshapearea column for us, but you might not like to use the garbled “bufferedsh” as an attribute name in your shapefile. A better approach would be to specify an alias for long column names in the
–sql statement itself. In this case, perhaps just “area” will suffice:
ogr2ogr -f "ESRI Shapefile" "C:tempsqlexport.shp"
"MSSQL:server=localhostsqlexpress;database=tempdb;trusted_connection=yes;"
-sql "SELECT shapeid, shapename, shapegeom, bufferedshape.ToString(), bufferedshapearea AS area  FROM OGRExportTestTable WHERE shapegeom.STGeometryType() = 'POINT'"
-overwrite
And now, for the first time, you should be both error and warning free:

So, now, just repeat the above but substituting the POINT, LINESTRING, and POLYGON geometry types, and creating three separate corresponding shapefiles:
ogr2ogr -f "ESRI Shapefile" "C:tempsqlexport_point.shp" "MSSQL:server=localhostsqlexpress;database=tempdb;trusted_connection=yes;" -sql "SELECT shapeid, shapename, shapegeom, bufferedshape.ToString(), bufferedshapearea AS area  FROM OGRExportTestTable WHERE shapegeom.STGeometryType() = 'POINT'" -overwrite

ogr2ogr -f "ESRI Shapefile" "C:tempsqlexport_linestring.shp" "MSSQL:server=localhostsqlexpress;database=tempdb;trusted_connection=yes;" -sql "SELECT shapeid, shapename, shapegeom, bufferedshape.ToString(), bufferedshapearea AS area  FROM OGRExportTestTable WHERE shapegeom.STGeometryType() = 'LINESTRING'" -overwrite

ogr2ogr -f "ESRI Shapefile" "C:tempsqlexport_polygon.shp" "MSSQL:server=localhostsqlexpress;database=tempdb;trusted_connection=yes;" -sql "SELECT shapeid, shapename, shapegeom, bufferedshape.ToString(), bufferedshapearea AS area  FROM OGRExportTestTable WHERE shapegeom.STGeometryType() = 'POLYGON'" -overwrite
All done, right? Let’s just have a quick check on the created files to make sure they look ok. You can do this using ogrinfo with the –al option, which will give you a summary of the elements contained in any spatial data set. I mean, I’m sure they’re fine and everything, but…. hang on a minute:
ogrinfo -al c:tempsqlexport_point.shp
Here’s the POINT shapefile:

Initially looks ok, the shapefile contains 2 Point features – they’ve got the correct attribute fields, but both points seem to have been incorrectly placed at coordinates of POINT(0.0 2.0). Huh?
What about the LINESTRING shapefile:

This is even worse – even though we specified that only LineString geometries should be returned from the SQL query, the created shapefile thinks it contains 2 Point features (
Geometry: Point, near the top). And those points both lie at POINT (0.0 0.0)…
And the POLYGON shapefile:

Same problem as the LineString – it’s effectively an empty Point shapefile.
The problem seems to be that, even though we’re only returning geometries of a certain type from the SQL query, we haven’t explicitly stated that to the shapefile creator, so OGR2OGR is creating three empty shapefiles first (each set up to receive the default geometry type of POINT), and then trying to populate them with unmatching shape types, leading to corrupt data. To explicitly state the geometry type of the shapefiles created, we need to supply the SHPT layer creation option for each shapefile as specified at
http://www.gdal.org/ogr/drv_shapefile.html, by adding –lco “SHPT=POLYGON”, –lco “SHPT=ARC” (for LineStrings) etc. as follows:
ogr2ogr -f "ESRI Shapefile" "C:tempsqlexport_point.shp"
"MSSQL:server=localhostsqlexpress;database=tempdb;trusted_connection=yes;"
-sql "SELECT shapeid, shapename, shapegeom, bufferedshape.ToString(), bufferedshapearea AS area  FROM OGRExportTestTable WHERE shapegeom.STGeometryType() = 'POINT'"
-overwrite
-lco "SHPT=POINT"

ogr2ogr -f "ESRI Shapefile" "C:tempsqlexport_linestring.shp"
"MSSQL:server=localhostsqlexpress;database=tempdb;trusted_connection=yes;"
-sql "SELECT shapeid, shapename, shapegeom, bufferedshape.ToString(), bufferedshapearea AS area  FROM OGRExportTestTable WHERE shapegeom.STGeometryType() = 'LINESTRING'"
-overwrite
-lco "SHPT=ARC"

ogr2ogr -f "ESRI Shapefile" "C:tempsqlexport_polygon.shp" "MSSQL:server=localhostsqlexpress;database=tempdb;trusted_connection=yes;"
-sql "SELECT shapeid, shapename, shapegeom, bufferedshape.ToString(), bufferedshapearea AS area  FROM OGRExportTestTable WHERE shapegeom.STGeometryType() = 'POLYGON'"
-overwrite
-lco "SHPT=POLYGON"
Unfortunately, that brings us round to almost exactly the same error as we first started with when creating the LineString and Polygon shapefiles (Gah! I thought we’d got rid of them!):
ERROR 1: Attempt to write non-linestring (POINT) geometry to ARC type shapefile
ERROR 1: Attempt to write non-polygon (POINT) geometry to POLYGON type shapefile
We
are only selecting geometries of the matching type for each shapefile by filtering the query based on STGeometryType(), so why does OGR2OGR think that we are selecting other types of geometries? What’s more, we haven’t yet explained why the point shapefile (which was, after all, being populated only with point geometries), incorrectly placed both points at coordinates POINT(0.0 2.0). It seems that something is corrupting the results of the SQL statement.
And here’s the “Ta-dah!” moment. According to
http://www.gdal.org/ogr/drv_mssqlspatial.html, when retrieving spatial data from SQL Server,
“The default [GeometryFormat] value is ‘native’, in this case the native SqlGeometry and SqlGeography serialization format is used”. However, this doesn’t actually appear to hold true. SQL Server stores geometry and geography data in a format very similar to, but slightly different from Well-Known Binary (WKB). The SQL Server binary values for the two points in the OGRExportTestTable are:
0x00000000010C0000000000002A400000000000002440
0x00000000010C0000000000001C400000000000002840
The Well-Known Binary of these two points is , instead, as follows:
0x01010000000000000000002A400000000000002440
0x01010000000000000000001C400000000000002840
As you can see, they’re very similar – the coordinate values are serialised as 8-byte floating point binary values in both cases, but the MSSQL Server native serialisation has a different and slightly longer (i.e. one byte more) header. Thus, if OGR2OGR is expecting to receive one type of data, but actually gets the other, all the bytes will be displaced slightly. This could explain both why OGR believed it was receiving the incorrect geometry types and also why the point coordinates were wrong.
To correct this, rather than retrieving the shapegeom value directly, use the STAsBinary() method in the SQL statement to retrieve the WKB of the shapegeom column instead.
ogr2ogr -f "ESRI Shapefile" "C:tempsqlexport_point.shp"
"MSSQL:server=localhostsqlexpress;database=tempdb;trusted_connection=yes;"
-sql "SELECT shapeid, shapename, shapegeom.STAsBinary(), bufferedshape.ToString(), bufferedshapearea AS area  FROM OGRExportTestTable WHERE shapegeom.STGeometryType() = 'POINT'"
-overwrite
-lco "SHPT=POINT"

ogr2ogr -f "ESRI Shapefile" "C:tempsqlexport_linestring.shp"
"MSSQL:server=localhostsqlexpress;database=tempdb;trusted_connection=yes;"
-sql "SELECT shapeid, shapename, shapegeom.STAsBinary(), bufferedshape.ToString(), bufferedshapearea AS area  FROM OGRExportTestTable WHERE shapegeom.STGeometryType() = 'LINESTRING'"
-overwrite
-lco "SHPT=ARC"

ogr2ogr -f "ESRI Shapefile" "C:tempsqlexport_polygon.shp" "MSSQL:server=localhostsqlexpress;database=tempdb;trusted_connection=yes;"
-sql "SELECT shapeid, shapename, shapegeom.STAsBinary(), bufferedshape.ToString(), bufferedshapearea AS area  FROM OGRExportTestTable WHERE shapegeom.STGeometryType() = 'POLYGON'"
-overwrite
-lco "SHPT=POLYGON"
Right, we are definitely making progress now. Trying ogrinfo again reveals that all of the layers have the correct number of features, or the appropriate type, and all have the right coordinate values. Yay!

There’s just one nagging thing and that’s the
Layer SRS WKT: (unknown). When we converted from the SQL Server native serialisation to Well-Known Binary, we lost the metadata of the spatial reference identifier (SRID) associated with each geometry. This information contains the details of the datum, coordinate reference system, prime meridian etc. that make the coordinates of each geometry relate to an actual place on the earth’s surface. In the shapefile format, this information is contained in a .PRJ file that usually accompanies each .SHP file but, since we haven’t supplied this information to OGR2OGR, none of the created shapefiles currently have associated .PRJ files, so ogrinfo reports the spatial reference system as “unknown”.
To create a PRJ file, we need to append the
–a_srs option, supplying the same EPSG id as was supplied when creating the original geometry instances in the table. (Of course, if you have instances of more than one SRID in the same SQL Server table, you’ll have to split these out into separate shapefiles, just as you have to split different geometry types into separate shapefiles)
The Final Product
So here’s the final script that will separate out points, linestrings, and polygons from a SQL Server table into separate shapefiles, via the WKB format but maintaining the SRID of the original instance, and retaining all other columns as attribute values in the .dbf file. Tested and confirmed to work with columns of either the geometry or geography datatype in SQL Server 2008/R2, or SQL Server Denali CTP3.
ogr2ogr -f "ESRI Shapefile" "C:tempsqlexport_point.shp"
"MSSQL:server=localhostsqlexpress;database=tempdb;trusted_connection=yes;"
-sql "SELECT shapeid, shapename, shapegeom.STAsBinary(), bufferedshape.ToString(), bufferedshapearea AS area  FROM OGRExportTestTable WHERE shapegeom.STGeometryType() = 'POINT'"
-overwrite
-lco "SHPT=POINT"
-a_srs "EPSG:2199"

ogr2ogr -f "ESRI Shapefile" "C:tempsqlexport_linestring.shp"
"MSSQL:server=localhostsqlexpress;database=tempdb;trusted_connection=yes;"
-sql "SELECT shapeid, shapename, shapegeom.STAsBinary(), bufferedshape.ToString(), bufferedshapearea AS area  FROM OGRExportTestTable WHERE shapegeom.STGeometryType() = 'LINESTRING'"
-overwrite
-lco "SHPT=ARC"
-a_srs "EPSG:2199"

ogr2ogr -f "ESRI Shapefile" "C:tempsqlexport_polygon.shp"
"MSSQL:server=localhostsqlexpress;database=tempdb;trusted_connection=yes;"
-sql "SELECT shapeid, shapename, shapegeom.STAsBinary(), bufferedshape.ToString(), bufferedshapearea AS area  FROM OGRExportTestTable WHERE shapegeom.STGeometryType() = 'POLYGON'"
-overwrite
-lco "SHPT=POLYGON"
-a_srs "EPSG:2199"
And here’s the resulting shapefile layers loaded into qGIS:


 ————————
Here is the syntax of the url:
http://www.google.com/search?q=transmission+servicing+lexington+ky&hl=en&safe=off
&client=safari&rls=en&prmd=imvns&source=lnms&tbm=plcs
&ei=-PbMTtWiDeXK0AHni8D6Dw
&sa=X&oi=mode_link&ct=mode&cd=8&ved=0CF0Q_AUoBw&prmdo=1
&bav=on.2,or.r_gc.r_pw.r_cp.,cf.osb&biw=1435&bih=721
&emsg=NCSR&noj=1&ei=CvnMTrGUH4Pz0gGZ5DQ
————————
Here is the syntax of the url:
http://www.google.com/search?q=transmission+servicing+lexington+ky&hl=en&safe=off
&client=safari&rls=en&prmd=imvns&source=lnms&tbm=plcs
&ei=-PbMTtWiDeXK0AHni8D6Dw
&sa=X&oi=mode_link&ct=mode&cd=8&ved=0CF0Q_AUoBw&prmdo=1
&bav=on.2,or.r_gc.r_pw.r_cp.,cf.osb&biw=1435&bih=721
&emsg=NCSR&noj=1&ei=CvnMTrGUH4Pz0gGZ5DQ
 In second example the Plus page for Manta has been integrated into the organic section of Places search for NEC Store Manhattan.


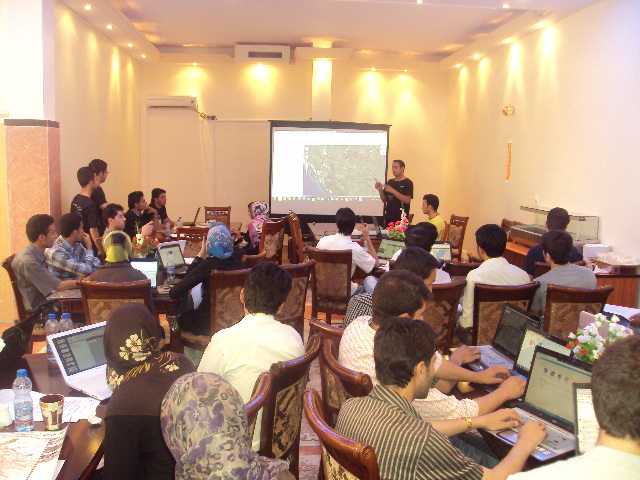
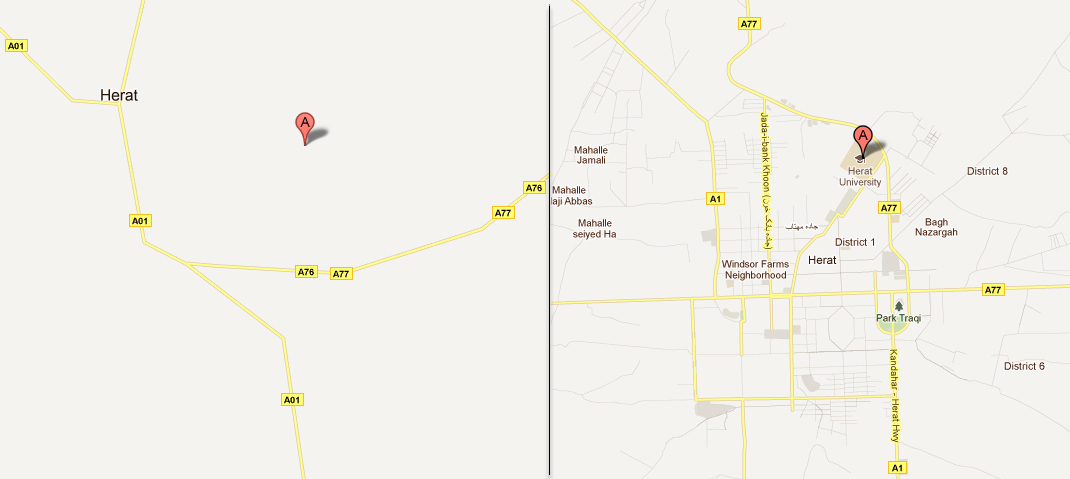 Herat, Afghanistan: The “before and after” efforts of volunteer mappers from Microsis, Afghan Citadel Software Company, Afghan Cybersoft, Asia Cyber Tech, Herat4soo.com and Taktech.
Represented by Hasen Poreya, the Afghan Map Makers presented their project during a June visit to the Mountain View and New York Google offices. According to Hasen, the group encountered many roadblocks from the very beginning; everything from connectivity issues to old satellite imagery and an initial lack of volunteers. Since then, they’ve laid out the map of Herat and several volunteers have already mapped most of Kabul, Afghanistan. You can watch a mapping time lapse of Herat here and Kabul here.
This story is far more significant than the mapping of a city. It is a story of young people in a community coming together, taking ownership of their future and serving their country in a truly entrepreneurial and meaningful way. Congratulations to Hasen, Sadeq, the Herat start-up teams and thousands of Map Makers in more than 180 other countries, helping to map the world.
Herat, Afghanistan: The “before and after” efforts of volunteer mappers from Microsis, Afghan Citadel Software Company, Afghan Cybersoft, Asia Cyber Tech, Herat4soo.com and Taktech.
Represented by Hasen Poreya, the Afghan Map Makers presented their project during a June visit to the Mountain View and New York Google offices. According to Hasen, the group encountered many roadblocks from the very beginning; everything from connectivity issues to old satellite imagery and an initial lack of volunteers. Since then, they’ve laid out the map of Herat and several volunteers have already mapped most of Kabul, Afghanistan. You can watch a mapping time lapse of Herat here and Kabul here.
This story is far more significant than the mapping of a city. It is a story of young people in a community coming together, taking ownership of their future and serving their country in a truly entrepreneurial and meaningful way. Congratulations to Hasen, Sadeq, the Herat start-up teams and thousands of Map Makers in more than 180 other countries, helping to map the world.

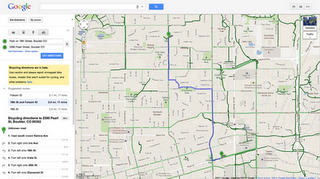
 Autocomplete makes sharing with others on the go even easier
 This year HelenOS, an operating system based on a multiserver microkernel design originating from Charles University, Prague, had the privilege of becoming a mentoring organization in the Google Summer of Code program. Our preparation began a couple of months before mentoring organizations started submitting their applications, but the real fun hit us when we were accepted as a mentoring organization and when the students started sending us their project proposals.
We put together about a dozen ideas for student projects and received about twenty or so official proposals. HelenOS had three mentors and we were thrilled to be given three student slots for our first year in the program. During the student application period we received a lot of patches from candidate students determined to prove their motivation and ability to work with us. It was no coincidence that the three students we chose submitted some of the most interesting patches and did the most thorough research. Two students sent us enough material to seriously attack the first milestones of their respective projects and the third student fixed several bugs, one of them on the MIPS architecture.
The three selected students were Petr Koupy, Oleg Romanenko and Jiri Zarevucky. Petr and Jiri worked on related projects focused on delivering parts of the C compiler toolchain to HelenOS while also improving our C library and improving compatibility with C and POSIX standards. Oleg chose to further extend our FAT file system server by implementing support for FAT12, FAT32, long file name extension and initial support for the exFAT file system.
When the community bonding period began and we started regular communication with our students, all three mentors, Martin Decky, Jiri Svoboda and Jakub Jermar, noticed an interesting phenomenon. Our students seemed a little shy at first, preferring one-on-one communication with their mentor, as opposed to more open communication on the mailing list. This bore some signs of the students expecting the same kind of interaction a student receives while working on a school project with a single supervisor and evaluator. Even though not entirely unexpected, this was not exactly how we intended for the students to communicate with the HelenOS team but we eventually managed to change this trend.
In short, all three of our students were pretty much technically trouble-free and met their mid-term and final milestones securely. To our relief, this was thanks to the students’ skills rather than projects being too easy. Two of our students were geographically close to their mentors so Jiri and Petr attended one or two regular HelenOS onsite project meetings held in Prague.
Besides the regular monthly team meetings, the HelenOS developers met for an annual coding week event called HelenOS Camp. This year the camp took place during the last coding week of the program and we were excited that one of our Google Summer of Code students, Petr Koupy, was able to join us for the event and hack with the rest of the HelenOS team.
Shortly after Google Summer of Code ended we merged contributions of all three students to our development branch, making their work part of the future HelenOS 0.5.0 release.
Below is a screencast showing HelenOS in its brand new role of a development platform, courtesy of Petr Koupy.
This year HelenOS, an operating system based on a multiserver microkernel design originating from Charles University, Prague, had the privilege of becoming a mentoring organization in the Google Summer of Code program. Our preparation began a couple of months before mentoring organizations started submitting their applications, but the real fun hit us when we were accepted as a mentoring organization and when the students started sending us their project proposals.
We put together about a dozen ideas for student projects and received about twenty or so official proposals. HelenOS had three mentors and we were thrilled to be given three student slots for our first year in the program. During the student application period we received a lot of patches from candidate students determined to prove their motivation and ability to work with us. It was no coincidence that the three students we chose submitted some of the most interesting patches and did the most thorough research. Two students sent us enough material to seriously attack the first milestones of their respective projects and the third student fixed several bugs, one of them on the MIPS architecture.
The three selected students were Petr Koupy, Oleg Romanenko and Jiri Zarevucky. Petr and Jiri worked on related projects focused on delivering parts of the C compiler toolchain to HelenOS while also improving our C library and improving compatibility with C and POSIX standards. Oleg chose to further extend our FAT file system server by implementing support for FAT12, FAT32, long file name extension and initial support for the exFAT file system.
When the community bonding period began and we started regular communication with our students, all three mentors, Martin Decky, Jiri Svoboda and Jakub Jermar, noticed an interesting phenomenon. Our students seemed a little shy at first, preferring one-on-one communication with their mentor, as opposed to more open communication on the mailing list. This bore some signs of the students expecting the same kind of interaction a student receives while working on a school project with a single supervisor and evaluator. Even though not entirely unexpected, this was not exactly how we intended for the students to communicate with the HelenOS team but we eventually managed to change this trend.
In short, all three of our students were pretty much technically trouble-free and met their mid-term and final milestones securely. To our relief, this was thanks to the students’ skills rather than projects being too easy. Two of our students were geographically close to their mentors so Jiri and Petr attended one or two regular HelenOS onsite project meetings held in Prague.
Besides the regular monthly team meetings, the HelenOS developers met for an annual coding week event called HelenOS Camp. This year the camp took place during the last coding week of the program and we were excited that one of our Google Summer of Code students, Petr Koupy, was able to join us for the event and hack with the rest of the HelenOS team.
Shortly after Google Summer of Code ended we merged contributions of all three students to our development branch, making their work part of the future HelenOS 0.5.0 release.
Below is a screencast showing HelenOS in its brand new role of a development platform, courtesy of Petr Koupy.

 So, now, just repeat the above but substituting the POINT, LINESTRING, and POLYGON geometry types, and creating three separate corresponding shapefiles:
 Initially looks ok, the shapefile contains 2 Point features – they’ve got the correct attribute fields, but both points seem to have been incorrectly placed at coordinates of POINT(0.0 2.0). Huh?
What about the LINESTRING shapefile:
Initially looks ok, the shapefile contains 2 Point features – they’ve got the correct attribute fields, but both points seem to have been incorrectly placed at coordinates of POINT(0.0 2.0). Huh?
What about the LINESTRING shapefile:
 This is even worse – even though we specified that only LineString geometries should be returned from the SQL query, the created shapefile thinks it contains 2 Point features (Geometry: Point, near the top). And those points both lie at POINT (0.0 0.0)…
And the POLYGON shapefile:
This is even worse – even though we specified that only LineString geometries should be returned from the SQL query, the created shapefile thinks it contains 2 Point features (Geometry: Point, near the top). And those points both lie at POINT (0.0 0.0)…
And the POLYGON shapefile:
 Same problem as the LineString – it’s effectively an empty Point shapefile.
The problem seems to be that, even though we’re only returning geometries of a certain type from the SQL query, we haven’t explicitly stated that to the shapefile creator, so OGR2OGR is creating three empty shapefiles first (each set up to receive the default geometry type of POINT), and then trying to populate them with unmatching shape types, leading to corrupt data. To explicitly state the geometry type of the shapefiles created, we need to supply the SHPT layer creation option for each shapefile as specified at http://www.gdal.org/ogr/drv_shapefile.html, by adding –lco “SHPT=POLYGON”, –lco “SHPT=ARC” (for LineStrings) etc. as follows:
Same problem as the LineString – it’s effectively an empty Point shapefile.
The problem seems to be that, even though we’re only returning geometries of a certain type from the SQL query, we haven’t explicitly stated that to the shapefile creator, so OGR2OGR is creating three empty shapefiles first (each set up to receive the default geometry type of POINT), and then trying to populate them with unmatching shape types, leading to corrupt data. To explicitly state the geometry type of the shapefiles created, we need to supply the SHPT layer creation option for each shapefile as specified at http://www.gdal.org/ogr/drv_shapefile.html, by adding –lco “SHPT=POLYGON”, –lco “SHPT=ARC” (for LineStrings) etc. as follows:
 There’s just one nagging thing and that’s the Layer SRS WKT: (unknown). When we converted from the SQL Server native serialisation to Well-Known Binary, we lost the metadata of the spatial reference identifier (SRID) associated with each geometry. This information contains the details of the datum, coordinate reference system, prime meridian etc. that make the coordinates of each geometry relate to an actual place on the earth’s surface. In the shapefile format, this information is contained in a .PRJ file that usually accompanies each .SHP file but, since we haven’t supplied this information to OGR2OGR, none of the created shapefiles currently have associated .PRJ files, so ogrinfo reports the spatial reference system as “unknown”.
To create a PRJ file, we need to append the –a_srs option, supplying the same EPSG id as was supplied when creating the original geometry instances in the table. (Of course, if you have instances of more than one SRID in the same SQL Server table, you’ll have to split these out into separate shapefiles, just as you have to split different geometry types into separate shapefiles)
There’s just one nagging thing and that’s the Layer SRS WKT: (unknown). When we converted from the SQL Server native serialisation to Well-Known Binary, we lost the metadata of the spatial reference identifier (SRID) associated with each geometry. This information contains the details of the datum, coordinate reference system, prime meridian etc. that make the coordinates of each geometry relate to an actual place on the earth’s surface. In the shapefile format, this information is contained in a .PRJ file that usually accompanies each .SHP file but, since we haven’t supplied this information to OGR2OGR, none of the created shapefiles currently have associated .PRJ files, so ogrinfo reports the spatial reference system as “unknown”.
To create a PRJ file, we need to append the –a_srs option, supplying the same EPSG id as was supplied when creating the original geometry instances in the table. (Of course, if you have instances of more than one SRID in the same SQL Server table, you’ll have to split these out into separate shapefiles, just as you have to split different geometry types into separate shapefiles)

 I missed this impressive use of custom Street Views by the New York Times when it was published back in May. However it is so good that it is worth posting even this long after the event.
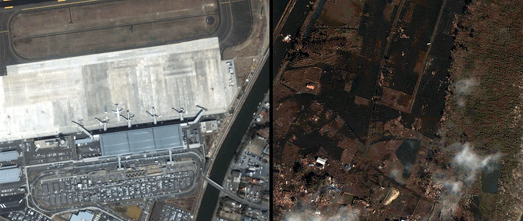
Panoramas of Joplin Before and After the Tornado uses Google Map Street Views of Joplin side by side with panoramas taken after the Joplin tornado hit.
A number of newspapers have created clever visualisations of the damage caused by natural disasters by using before and after satellite imagery. For example both ABC News and The NYT published comparisons of satellite imagery of Japan before and after this year's earthquake.
I missed this impressive use of custom Street Views by the New York Times when it was published back in May. However it is so good that it is worth posting even this long after the event.
Panoramas of Joplin Before and After the Tornado uses Google Map Street Views of Joplin side by side with panoramas taken after the Joplin tornado hit.
A number of newspapers have created clever visualisations of the damage caused by natural disasters by using before and after satellite imagery. For example both ABC News and The NYT published comparisons of satellite imagery of Japan before and after this year's earthquake.
 The New York Times however are the first newspaper to create a before and after visualisation using Street View. The paper took a number of 360 degree photos of areas of Joplin after the May tornado. They then used the Custom Street View functionality in the Google Maps API to create Street Views from their panoramas.
The custom panoramas have been placed side-by-side with the Google Maps Street Views from the same location. As you pan the Street View the custom panorama moves to show exactly the same view, to show the devastation caused by the earthquake.
Via: Google Maps for Journalists
The New York Times however are the first newspaper to create a before and after visualisation using Street View. The paper took a number of 360 degree photos of areas of Joplin after the May tornado. They then used the Custom Street View functionality in the Google Maps API to create Street Views from their panoramas.
The custom panoramas have been placed side-by-side with the Google Maps Street Views from the same location. As you pan the Street View the custom panorama moves to show exactly the same view, to show the devastation caused by the earthquake.
Via: Google Maps for Journalists


 I haven’t personally tried it, but I understand that Microsoft Virtual PC suffers from the same problem, so don’t bother going there either.
Fortunately, (and slightly ironically) Oracle’s Virtual Box seems to have more success loading the Windows 8 image than either VMWare’s or Microsoft’s offerings. So, grab a Virtual Box if you haven’t already (why not? It’s free!) and create a new system, using “Other Windows” as the OS type. I don’t know what the minimum required specs are for Windows 8, but I gave the VM 4096Mb of RAM and 60Gb hard drive, which should be plenty. Choose to create a new start-up hard disk using the VDI file format. (More detailed instructions on these steps can be found at http://www.windows7hacker.com/index.php/2011/09/install-windows-8-developer-preview-on-virtualbox/)
Once the machine is created, start it up and on the “installation media” dialog box, navigate to the WindowsDeveloperPreview-64bit-English-Developer.iso image on the host machine. Then finish the wizard and, if all goes well, you should shortly be seeing this:
I haven’t personally tried it, but I understand that Microsoft Virtual PC suffers from the same problem, so don’t bother going there either.
Fortunately, (and slightly ironically) Oracle’s Virtual Box seems to have more success loading the Windows 8 image than either VMWare’s or Microsoft’s offerings. So, grab a Virtual Box if you haven’t already (why not? It’s free!) and create a new system, using “Other Windows” as the OS type. I don’t know what the minimum required specs are for Windows 8, but I gave the VM 4096Mb of RAM and 60Gb hard drive, which should be plenty. Choose to create a new start-up hard disk using the VDI file format. (More detailed instructions on these steps can be found at http://www.windows7hacker.com/index.php/2011/09/install-windows-8-developer-preview-on-virtualbox/)
Once the machine is created, start it up and on the “installation media” dialog box, navigate to the WindowsDeveloperPreview-64bit-English-Developer.iso image on the host machine. Then finish the wizard and, if all goes well, you should shortly be seeing this:
 Note that, if you don’t see the above, but see an error status 0xc0000225 An unexpected error has occurred instead …
 … then it’s possibly because you haven’t got the APIC setting enabled on the BIOS for your virtual machine. Shutdown the VM, then open the VirtualBox settings and ensure that the checkbox highlighted below is checked:
 Now try booting the VM up again.

 The important things to note are that a) I’d never rendered a 3D model before, and b) this only took me a couple of hours to figure out. Photo-realistic rendering is still far from easy, but Shaderlight gives dopes like me a fighting chance.
The newest version of Shaderlight includes two major new features. The first is something called Replace Me. It lets you model with low-poly “proxy” objects, but then specify deliciously high-poly substitutes that Shaderlight uses when it renders. You get the best of both worlds: speedy performance in the model and better realism in the render.
The other new hotness is Rendered Animations. Shaderlight can use SketchUp’s scene-based animation settings to automatically create a photo-rendered video. Too cool. Congrats to the team at ArtVPS on getting this update out the door. It looks great.
Until the end of September, new customers can save 25% on Shaderlight Pro licenses. The promo code to use at checkout is 09PROMO.
The important things to note are that a) I’d never rendered a 3D model before, and b) this only took me a couple of hours to figure out. Photo-realistic rendering is still far from easy, but Shaderlight gives dopes like me a fighting chance.
The newest version of Shaderlight includes two major new features. The first is something called Replace Me. It lets you model with low-poly “proxy” objects, but then specify deliciously high-poly substitutes that Shaderlight uses when it renders. You get the best of both worlds: speedy performance in the model and better realism in the render.
The other new hotness is Rendered Animations. Shaderlight can use SketchUp’s scene-based animation settings to automatically create a photo-rendered video. Too cool. Congrats to the team at ArtVPS on getting this update out the door. It looks great.
Until the end of September, new customers can save 25% on Shaderlight Pro licenses. The promo code to use at checkout is 09PROMO.