Friday, September 30, 2011

Google Places Bugs

 
Bugs keep cropping up in the Places Dashboard and Places. Yesterday I received the “No such State/Province in this country” message as did several other users. Today I am getting the “System Error – We’re sorry, but we are unable to serve your request at this time. Please try back in a few minutes” bug when trying to save a listing. I think Google Places Flu Season is upon us.
The Smooshed Phone Number Bug (otherwise known as SPNB1). It manifests itself by smooshing (a very technical geek term) your phone number together twice in the phone number field. The information is displayed in both Places and worse, on the main search results. Props to Linda Buquet for first pointing this bug out. The bad phone number also manifests itself in the mobile search results and generates the obvious “Please check the number and dial again” response when dialed.  

Thursday, September 29, 2011

Google Earth: The Peace-Athabasca Delta

In just three minutes, you can take a non-stop, coast-to-coast Google Earth narrated tour of Earth’s “green halo:” the boreal forest. The Pew Environment Group takes you over the vast northern forests and waterways and unveils an ecosystem that stores twice as much carbon per acre as tropical rainforests, holds more freshwater than any other continental-scale ecosystem and teems with wildlife. Watch the tour below or download the KML file to view in Google Earth.
The Peace-Athabasca Delta viewed in the Pew Environmental Group's new Google Earth tour.
Unfortunately, Canada’s boreal forest is increasingly affected by large-scale industrial activities. A rapidly expanding footprint of development already includes 180 million acres (728,000 km²) affected by forestry, road building, mining, oil and gas extraction, and hydropower. Pew and CBI have worked with aboriginal communities, conservation groups, federal, provincial and territorial governments to protect the boreal, resulting in 185 million acres set aside from development to date, including key wetland and river areas. That total represents more than 12% of Canada’s 1.2 billion-acre (nearly 4.9 million km²) boreal forest.

Google Places Challenge

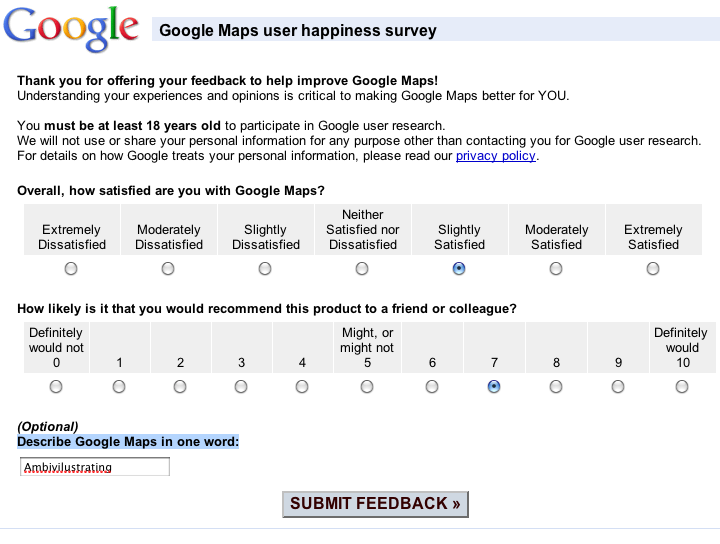
  Google has recently added a “Take our Survey” link to the Places page. It is a simple 2 question, rate your satisfaction survey with an optional third question. It was the third question that intrigued me: Describe Google Maps in one word. I love Google Maps. I hate Google Maps. I find it exhilarating when it works and am continually frustrated by its quirks and oddities. I find it a challenge to understand and simple. It can help a business become successful and drive that same business to the the depths of despair. I am in awe and desperation. ALL AT THE SAME TIME. Ambivalent? For sure but that hardly captures my feelings in one word. I have trouble coming up with one word that describes the jambalaya of thoughts and feelings about Places. My challenge to you: Describe Google Maps. Come up with one word that captures your sense of (sur)reality when it comes to Maps and Places!  

Wednesday, September 28, 2011

The Google Apps Marketplace

  Google recently announced that over 4 million businesses now run on Google Apps, continuing its growth as enterprise software that focuses on collaboration. This of course is great news for Google Apps developers, since this means there are 4 million potential customers on the Google Apps Marketplace looking for complimentary tools to enhance their productivity. As you know, listing an app requires just a few quick steps, and the Marketplace targets a growing audience of customers ready to purchase additional solutions. So what kind of success might you see on the Marketplace and how can you maximize revenue? As the founder of GQueues, an online task manager, I have listed the app on the Marketplace since its launch in March 2010. Over the past year and half, I have found the Marketplace to be my most successful channel, and have discovered a few tips along the way that proved key to this success.

Solve a Real Problem

Though this seems obvious, this first point is critical: make sure your app solves a real problem. This means you’ve identified actual people and businesses that have this problem and are actively looking for a solution. Perhaps they have already tried other tools or cobbled something together on their own. For example, I’ve verified Google Apps users are looking for an intuitive way to organize their work and manage tasks with others. GQueues fills this need as a full-featured task manager that allows users to assign tasks, share lists, set reminders, create tasks from email and tag work for easy filtering. Google Apps users come to the Marketplace with a variety of needs, make sure your app addresses at least one of them.

Create Several Points of Integration

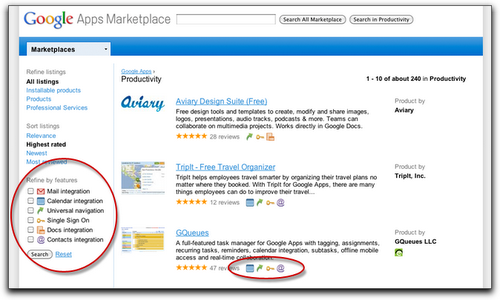
As you solve a customer’s problem, make sure you integrate with their existing tools. For Marketplace customers, this means adding as many integration points with Google products as possible. This is important for several reasons. First, it’s great for the user and facilitates adoption. If your service works seamlessly with other products they are already familiar with, they don’t have to spend time learning something new. For instance, GQueues has two-way syncing with Google Calendar. Since users already know how to drag events to new dates in Calendar, dragging GQueues tasks around the calendar is quite intuitive. Secondly, more integration directly helps your app’s listing in the Marketplace. Each listing has a set of icons representing product integrations. GQueues integrates with Calendar, Mail, Contacts and Google Talk, which indicates to a customer that using this tool will allow their users to work more efficiently. Plus, customers can search based on integration points, so the more you have, the broader your presence in the Marketplace.
Lastly, integrating with existing products speeds development. Utilizing Google APIs allows you to innovate faster and respond to your customers growing needs. GQueues uses the XMPP service of Google App Engine, which eliminated the need to build a separate chat backend and makes it easy for users to add tasks by chatting a message from anywhere.

Engage Your Customers

Once you’ve listed your deeply integrated app that solves a real problem on the Marketplace, be sure to engage with your customers. The Marketplace allows users to rate your app and leave verified reviews, which not only impact the app’s listing position, but greatly influence potential customers’ willingness to test it out. I manage the GQueues Marketplace listing with a two-fold approach:
  1. Encourage happy customers to leave a review after a successful support interaction
  2. Reach out to users leaving negative reviews to address their specific issue and understand better how the app can be improved.
These actions are quite simple, but immensely effect your app’s presence in the Marketplace.

Marketplace Impact

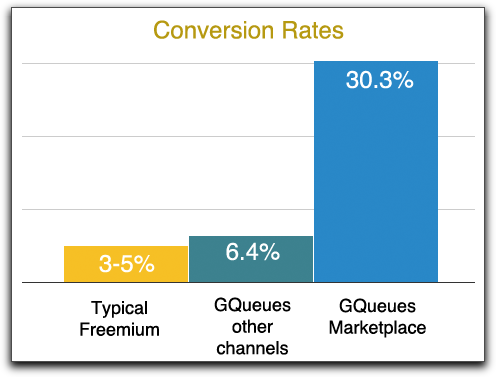
Though each app is unique, I’ve found that following the tips mentioned above have helped the Google Apps Marketplace become GQueues’ top revenue channel. GQueues is based on a freemium model, and the average conversion rate for a typical freemium product is 3-5%. Looking at all the regular channels, GQueues has a 6% average conversion rate from free users to paid subscribers - slightly higher than expected. However, the GQueues users from the Marketplace convert at an astonishing rate of 30%. The Marketplace claims to target an audience ready to buy, and the data really backs this up.
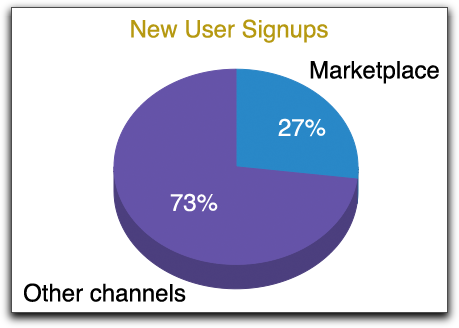
Not only does the Marketplace have a substantially higher conversion rate, but it also drives a considerable amount of traffic. Looking at the data over the same period, 27% of all new GQueues users were acquired via the Marketplace.
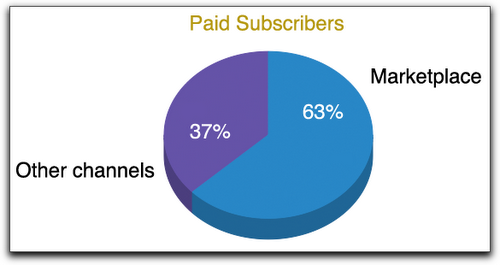
Combining the acquisition rate with the conversion rate shows that the Marketplace is actually responsible for 63% of all paid GQueues users.
As Google Apps continues to grow worldwide, the need for deeply integrated, complimentary business tools will also expand. Based on my experience with GQueues, I strongly recommend the Google Apps Marketplace as a rewarding channel for apps that integrate with Google Apps.

2011 App Engine events

 
Buenos días desde Buenos Aires!! Wow, we are just blazing through the summer! We had an exciting Google I/O in May where we saw the launch of the Go runtime, introduction of the Backends feature, and confirmed Google's commitment to the platform with our plans to leave preview mode, not to mention the five releases since that time. We then hit the road this summer with team members appearing around the globe, including mega events like the Cloud Computing Expo, EuroPython, and OSCON.  At Google I/O, many App Engine team members gave in-depth technical sessions. Alfred Fuller, an App Engine Datastore engineer, revealed how the High Replication datastore gives greater reliability and availability for users. Michael Handler, one of App Engine’s talented Site Reliability Engineers, discussed how App Engine works in production. At OSCON, the largest open source event in the world, yours truly gave a three-hour App Engine overview and workshop to help new users get up to speed, and earlier in the year at PyCon, described how Python users can avoid “vendor lock-in” via the Django-nonrel project by porting their applications from webapp to Django, allowing them to move on to or off of App Engine as they please with only minor configuration changes. We participate in events like these because we like to communicate with users to find out what they like & don’t like about the platform, and we often take their suggestions to heart! This fall we have a full schedule, appearing at many developer events worldwide, including Google Developer Days and Google DevFests. At the Google events, we'll recap App Engine and those announcements we made at I/O, and you’ll learn how to build exciting applications using App Engine and other Google cloud technologies as well as how to build games in the cloud. Here are the dates, events, and locations that we will be visiting: Fall 2011 Sep 19-20 - Google Developer Day Argentina - Buenos Aires - Wesley Chun, Chris Schalk Sep 19-23 - Strata - New York - Chris Schalk Sep 23-24 - PyCon Argentina - Junín - Wesley Chun Sep 26-30 - Congresso Brasileiro de Software - São Paulo - Wesley Chun Sep 29-Oct 1 - Python Brasil[7] - São Paulo - Wesley Chun Oct 8-9 - Silicon Valley CodeCamp - Los Altos Hills - Wesley Chun Oct 10 - Google Developer Day Russia - Moscow - Iein Valdez, Fred Sauer Oct 18 - Google Developer Day Czech Republic - Prague - Iein Valdez, Fred Sauer Oct 20 - Google DevFest France - Paris - Iein Valdez, Johan “Proppy“ Euphrosine Nov 1 - Google Developer Day Japan - Tokyo - Takashi Matsuo, Johan “Proppy“ Euphrosine Nov 8 - Google Developer Day Australia - Sydney - Chris Schalk, Johan “Proppy“ Euphrosine Nov 8 - Google DevFest Spain - Barcelona - Iein Valdez, Michael Manoochehri Nov 12 - Google DevFest Singapore - Singapore - Chris Schalk Nov 13 - Google Developer Day Israel - Tel-Aviv - Michael Manoochehri Nov 14 - Devoxx - Antwerp - Iein Valdez Nov 16 - Google DevFest Indonesia - Jakarta - Chris Schalk Nov 19 - Google Developer Day Germany - Berlin - Michael Manoochehri If these aren't close enough to you, keep an eye out on this list as we'll add new events and locations as they are scheduled. A calendar with all of Google's developer events is also available. We look forward to meeting you soon!

Sunday, September 25, 2011

Google Earth 6.1 now available

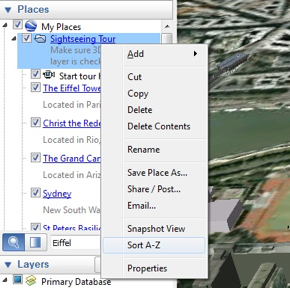
We are pleased to announce new features available in Google Earth. The Google Earth 6.1 update includes enhancements to make Google Earth easier than ever for both everyday users and business professionals. Easier to use My Places If you’re like me, your growing collection of maps in the My Places panel is getting a bit unwieldy. Every time I find a great new map or upload a new GPS track, it gets a little harder to find things. With this release, we’ve added a couple of new features to help you clean house a bit and find things more easily. First, we’ve added the ability to sort a folder - just right click on any folder and choose “Sort A-Z.” We’ve also made our My Places search feature easier to find; now all you have to do is type in the name of a map or a feature and it will highlight in the My Places panel.
You can now sort your My Places folders to improve organization.
Improved Street View Building on the improvements we made to the Street View experience in Google Earth 6, we’ve now added even more Street View features, including better zoom control through the slider tool and a wider field of view similar to Google Maps. You can now also navigate from one place to another with just a single-click of the mouse. These features make Street View in Google Earth more immersive, while performance improvements create a faster, smoother overall experience.
Street View in Google Earth now has a wider field of view.
Google Earth Pro While these features are available to all of our users, much of the work we’ve done in Google Earth 6.1 benefits power users and professionals who use Google Earth Pro, including:
  • Enhanced print layout: Pro users can now include scale bars and directional arrows when printing, making it easy to include all relevant information in client presentations.
  • Simplified movie maker: It’s now easier to convert saved tours to video and record live actions from the 3D viewer to really bring your presentation to life.
  • Expanded data styling: Control up to 64 unique style attributes for imported datasets.
  • Improved networking infrastructure: Earth Pro 6.1 received a robust network update, which offers better support for network proxies and SSL certificates commonly found in corporate networking environments.
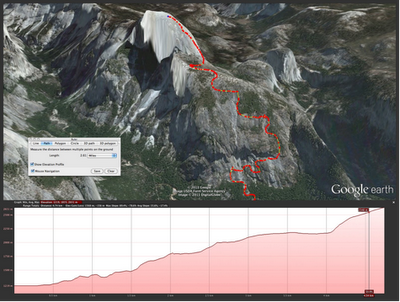
  • Combined elevation profiles and ruler tool: We know that sometimes distance is only one part of the equation. We’ve tied elevation profiles into the ruler tool, making it possible to take into account the entire 3D environment when measuring distance.

Combined ruler and elevation profile tool used to measure Yosemite’s Half Dome Peak.
We hope these enhancements make it even more fun and exciting to explore the planet, wherever you are in the world. Download Google Earth 6.1 to get started.

Friday, September 23, 2011

Easy Ways to Reduce Fuel Costs

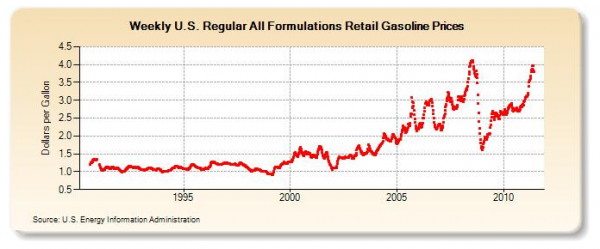
$4.00 per gallon for regular and $4.50 per gallon for diesel. With gas prices on the rise throughout the US, increasing fuel costs present a massive concern for anybody who has to get behind the wheel, but for business owners, who may have dozens or even hundreds of vehicles in their fleet, high fuel costs are a particularly serious issue. And while consumers may have the ability to carpool, reduce vehicle weight, or even drive more fuel efficient cars, business owners do not always share the same driving luxuries. Products have to ship, routes have to be driven, and jobs have to be driven to. We pride ourselves in helping business gain efficiencies (and even on being money-makers for folks), but many of the best ways of cutting costs with gas prices are like diet and exercise: really hard to do, yet not the least bit complex. So regardless of whether or not gas prices go down this summer – and economists seem to be divided on what they think is going to happen on that front – we thought this would be an appropriate time to share some well known, but often overlooked, ways to increase your fuel fitness and help you prune at the pump this summer. 1. Fill Up the Air in Your Tires: You’ve heard this one before, but keeping your tires full helps reduce friction. So think of full tires as the bicep curls of fuel fitness… and pump ‘em up! As with weight lifting, you don’t want to over inflate, but the exact number of pounds per square inch (or PSI) guidelines you’ll want to follow can often be found on the inside of your vehicle door. And odds are that you, like us, could be more diligent about filling up your tires regularly. 2. Find the Cheapest Gas Near Your Home or Work: If you’re doing long distance drives you have less control over where you stop for gas, but for your day-to-day drives, there are a number of services, of which Gas Buddy is probably the best known, that can help you find the cheapest current local gas prices from your computer or mobile device. So try plotting your route to work and seeing if you can shave a few cents per gallon by mixing up where you stop for gas on your way into the office. 3. Change Your Air Filters: In addition to increasing your vehicle’s power, increasing the air filter regularly is a great way to increase power, prolong engine life and also improve fuel economy. So be sure to contact someone who really knows your vehicle and be good about rotating your air filter regularly. Also, note that your mechanic may or may not be biased toward having you replace the air filter more frequently than you need to, so sometimes it’s best to get several opinions on how often you need to replace your air filters.   4. Consider Eco Tuning: You’ve likely heard the buzzword or perhaps heard folks talking about using replacement chips for your engine computer that increase the power while at the same time saving gas. How does that all work? Well, it might sound complex, but you don’t actually need to be a computer expert on complex technologies like IMAP forwarding or hosted exchange to get the basics. Essentially, eco tuners improve both ends of the curve. At higher speeds they give you more power with reduced efficiency and at lower speeds they give you better efficiency. You just choose with the gas pedal which mode your vehicle uses. 5. Close Your Windows: Believe it or not, similar to how ski racks can increase friction while driving, opening your windows can increase turbulence and cost you fuel. So to the extent that you’re able to, try relying on your car’s ventilation system rather than driving with your windows down. Over long distances and at higher speeds, this can really help your fuel economy. 6. Fill Up Less Frequently: Don’t fill up unless you are on empty or at least close to having the light go on. Admittedly, when gas prices are rising it can make sense to fill up before prices increase further, so there may be other factors to consider, but as a general standard try not to always drive around with a full tank. It will mean less cargo load for your vehicle to carry. There are a myriad of other ways to increase fuel efficiency, but hopefully this post helps gives you a few initial money saving tips to consider. If you have any tips or tricks of your own that you’d like to add, we’d love to hear them. Please share in the comments.

Tuesday, September 20, 2011

South Sudan is now on Google Maps

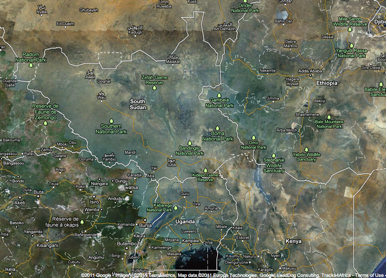
Following the Republic of South Sudan's recognition as the UN's 193rd Member State, we have updated Google Maps and Google Earth to reflect the new country borders. Satellite view of the Republic of South Sudan Google -- along with the World Bank, UNOSAT, and RCMRD-- is also helping to create better maps of South Sudan by supporting communities who map schools, hospitals, roads, and more with Google Map Maker. The events kicked off in late April at the World Bank Headquarters in Washington, D.C., and a satellite event in Nairobi at the same time.   The most recent of several organized community mapping events was hosted on September 7th by the South Sudan National Bureau of Statistics in Juba. Information Minister Dr. Barnaba Marial Benjamin indicated that such mapping efforts help bring together South Sudanese from all over the world. The events provide them with new ways to share knowledge and experiences.

Monday, September 19, 2011

Spatio-temporal Event Processing with Bing Maps


Thinking about the data I was using, I tried to think of a typical way in which you’d want to query the information relating to the outbreak of an infectious disease. Here’s what I came up with – let’s suppose that the disease is airborne and spread by droplets. In which case, you can define the geographic extent of the area that has been affected by creating the convex hull around all the locations that have had reported incidents (if you’re in a location and places to the west, east, south, and north of you have all had confirmed cases, I’d say you lie in an infected area even if you haven’t directly had any cases at your location). What’s more, let’s say that, after an outbreak has been confirmed at a location, it takes 30 days before that area can be declared “all clear” and free of the infection.
Bear in mind that I’m not an epidemiologist and I have no idea if these assumptions are anything like accurate, but they’ll work for me in this example. So, in order to define (and plot on a map) the areas of the world affected by the disease at any point in time, I’d want to determine all those points that lay within the convex hull formed from the locations of any incidents that had occurred in the preceding 30 days. This seemed like a reasonable case for a spatio-temporal query, so let’s just pass over the medical accuracy or not of the assumptions…

Defining the Hopping Window

The basic query I’d set up last time just selected all the events from the input stream, as follows:
var query = from e in inputStream
            select e;
This time, rather than just select each individual event, I wanted to create a hopping window – a window that selects only those events that occur within a particular, sliding timeframe. Then I’d want to perform an aggregate of the payload fields of the events contained within that window.
I’d already decided that the extent of my window would cover a period of 30 days (to capture all those occurrences that were still contagious at any given point in time), and I wanted to examine the cases that fell within that window on a day-by-day basis – i.e. my window would “hop” forward by one day each time. There was no point defining a hop size of less than a day, since the granularity of my input data was only recorded at date level.
Both the window size and the hop size are defined as timespan parameters to a HoppingWindow acting on an input stream. So, I changed the first part of my query to look like this:
var query = from e in inputStream.HoppingWindow(
                        TimeSpan.FromDays(30), // Window size
                        TimeSpan.FromDays(1))  // Hop size
            ... // Do something with the events that fall in this window
Next, I needed to create the aggregate function to act upon those events in the window.

Creating a Custom StreamInsight Aggregate function

To create the convex hull of the set of points contained within a particular window, I needed to create an aggregate function that derives from the CepAggregate base class. There’s an MSDN article at http://msdn.microsoft.com/en-us/library/ee842720.aspx that gives an example, although it fails to mention where you’d actually find that class (it’s in Microsoft.ComplexEventProcessing.Extensibility, incidentally). In my case, I wanted a function that would act upon an input set of strings (remember that my payload contained the location of each outbreak as a WKT Point), and return a string (the WKT of a Polygon created from the convex hull of those points). Here’s the function I created:
  public class ConvexHull : CepAggregate
  {
    public override string GenerateOutput(IEnumerable eventData)
    {
      // First, create a MultiPoint of all Points in the current window
      var gb = new SqlGeographyBuilder();
      gb.SetSrid(4326);
      gb.BeginGeography(OpenGisGeographyType.MultiPoint);
      foreach (var d in eventData)
      {
        // Create a geography instance from the WKT of each event
        SqlGeography point = SqlGeography.Parse(d);
        gb.BeginGeography(OpenGisGeometryType.Point);
        gb.BeginFigure((double)point.STX, (double)point.STY);
        gb.EndFigure();
        gb.EndGeography();
      }
      gb.EndGeography();

      // Now, create the Convex Hull of that MultiPoint
      SqlGeography convexhull;
      convexhull = gb.ConstructedGeography.STConvexHull();
      // Return the WKT of the Convex Hull
      return convexhull.ToString();
    }
  }
Notice that, as with the location data in the payload of each event, I’m using the WKT text format for all inputs and outputs of my spatial functions. This incurs a little extra cost in parsing the input into each function, but it just makes the workflow that much easier to debug. I’m also using the ConvexHull() method of the SqlGeography datatype, which is newly introduced in the SqlServer.Types.dll library that ships with SQL Server Denali.
Before you can actually call this function from the Stream Insight query, you need to register a LINQ extension method that wraps the aggregate in such a way that it can be called from LINQ. Here’s my LINQ Extension wrapper:
  public static class UDAExtensionMethods
  {
    [CepUserDefinedAggregate(typeof(ConvexHull))]
    public static string CHull(this CepWindow window, Expression> map)
    {
      throw CepUtility.DoNotCall();
    }
  }
Calling the CHull aggregate method (remember to use the name of the LINQ wrapper, not the UDA itself) to calculate the convex hull around all those points whose location is defined by the WKT field in the event payload contained within the window at any time meant that my modified query now looked like this:
var query = from x in inputStream.HoppingWindow(
                        TimeSpan.FromDays(30),
                        TimeSpan.FromDays(1))
            select x.CHull(p => p.WKT);
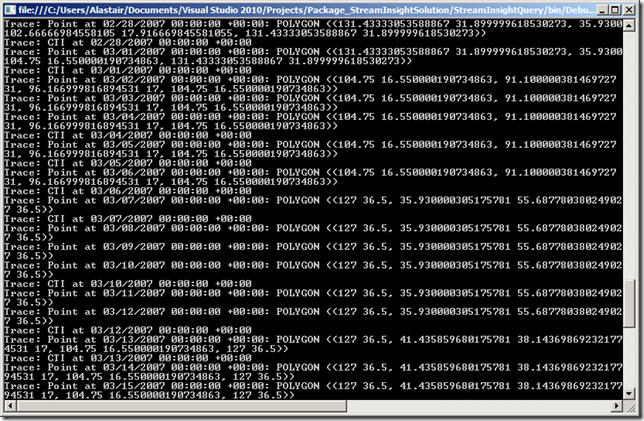
Now, re-running my project gave the output on the console window as shown below – for each day covered by the extent of the data (still shown in mm/dd/yyyy format because of the OutputTracer output adaptor I’m using – grrrr), the results show the Polygon formed from the convex hull of any points that occurred in the preceding 30 days.
image

Messages for Japan

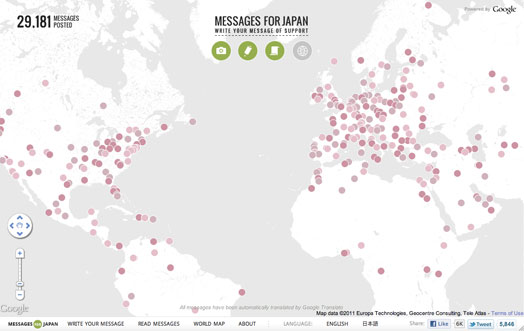
From Paris to Dubai to Manila, nearly 30,000 messages have been posted through messagesforjapan.com.
This past weekend marked the celebration of Tanabata in Sendai, the largest city in the disaster area and home to one of the most famous festivals in the country. People often celebrate Tanabata, which means "Evening of the Seventh,” by writing wishes on tanzaku (small strips of paper) and hanging them on bamboo branches. This year, these paper strips displayed some of the messages of hope submitted through the site, and festival participants added their own messages to those from around the world.

Tuesday, September 13, 2011

Mountain View brings faculty back to the drawing board

School may still be out for summer, but teachers remain hard at work. This week, we hosted Google’s inaugural Faculty Institute at our Mountain View, Calif. headquarters. The three-day event was created for esteemed faculty from schools of education and math and science to explore teaching paradigms that leverage technology in K-12 classrooms. Selected via a rigorous nomination and application process, the 39 faculty members hail from 19 California State Universities (CSUs), as well as Stanford and UC Berkeley, and teach high school STEM (Science, Technology, Engineering and Math) teachers currently getting their teaching credentials. CSU programs credential 60 percent of California’s teachers—or 10 percent of all U.S. K-12 teachers—and one CSU campus alone can credential around 1,000 new teachers in a year. The purpose of gathering together at the Institute was to ensure our teachers’ teachers have the support they need to help educators adjust to a changing landscape. There is so much technology available to educators today, but unless they learn how to use it effectively, it does little to change what is happening in our classrooms. Without the right training and inspiration, interactive displays become merely expensive projection screens, and laptops simply replace paper rather than shifting the way teachers teach and students learn. Although the possibilities for technology use in schools are endless, teacher preparation for the 21st century classroom also has many constraints. For example: beyond the expense involved, there’s the time it costs educators to match a technological innovation to the improvement of pedagogy and curriculum; there’s a distinct shift in thinking that needs to take place to change classrooms; and there’s an essential challenge to help teachers develop the dispositions and confidence to be lifelong evaluators, learners and teachers of technology, instead of continuing to rely on traditional skill sets that will soon be outdated. The Institute featured keynote addresses from respected professors from Stanford and Berkeley, case studies from distinguished high school teachers from across California, hands-on technology workshops with a variety of Google and non-Google tools, and panels with professionals in the tech-education industry. Notable guests included representatives from Teach for America, The New Teacher Project, the Department of Education and Edutopia. Topics covered the ability to distinguish learning paths, how to use technology to transform classrooms into project-based, collaborative spaces and how to utilize a more interactive teaching style, rather than the traditional lecture model. On the last day of the Institute, faculty members were invited to submit grant proposals to scale best practices outside of the meeting. Deans of the participating universities will convene at the end of the month to further brainstorm ways to scale new ideas in teacher preparation programs. Congratulations to all of the faculty members who were accepted into the inaugural Institute, and thank you for all that you do to help bring technology and new ways of thinking into the classroom.
This program is a part of Google’s continued commitment to supporting STEM education. Details on our other programs can be found on www.google.com/education.

Monday, September 12, 2011

FixMyTransport.com

FixMyTransport.com Beta

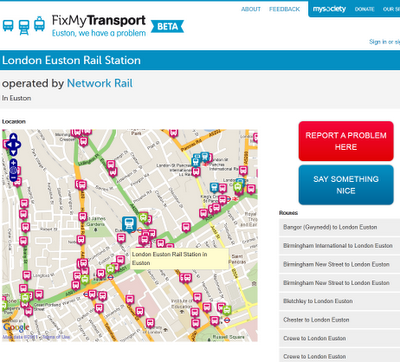
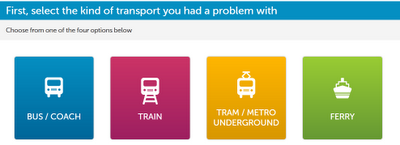
FixMyTransport Clean Mapping Interface to report problems with your routes (bus, train,tram/metro ferry) FixMyTransport options FixMyTransport was built to help people get common public transport problems resolved. It is targeted specifically at smaller problems such as persistently broken ticket machines, buses that always leave early, or silly rules that appear to do nothing but create inconvenience for travellers. What is it all about? At a basic level, FixMyTransport makes it easy for people to send problem reports to the companies or authorities responsible for those problems. However, we know that simply sending an email often won't be enough to get a problem resolved. That's why we've built a complete system to make it easy to gather support other people, whether fellow commuters, colleagues or friends. We believe that this is worth doing because a transport company that doesn't respond to one person may very well respond to ten. We hope that FixMyTransport will also help people by becoming part of the wider internet community of transport activists and campaigners. In particular, we hope that that community comes to see FixMyTransport as a place where experts and old hands can transfer their skills to people who have little or no experience of lobbying for change. As well as being aimed at helping people to solve transport problems, FixMyTransport represents an experiment to discover whether a sufficiently well designed internet service can help tip people over the edge from grumbling about a problem to taking action to resolve it. We welcome your thoughts on how to measure whether or not we're succeeding. Created by http://www.mysociety.org/ FixMyTransport.com Beta (with map interface openlayers/googlemaps) http://www.fixmytransport.com/

Google Places Descriptor

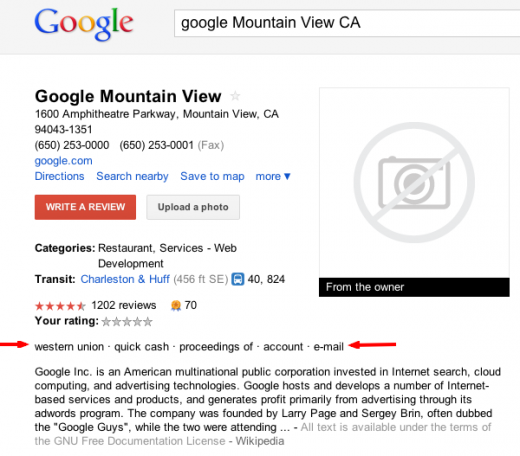
  One of the changes in the rollout of the new Places Page last month was the inclusion of short descriptor snippets high on the page between the review count and the business description. The descriptor snippets, besides recently changing from a light grey to black in color, have seemed to improve somewhat over the last month. In the case of Barbara Oliver, the strange phrase “couldn’t have” has been replaced with the more appropriate “felt comfortable”. Note the inclusion though of the oddly spelled “jewelery”. The phrases seem to have a variety of sources including a Place’s review corpus, in bound links and web page content. The algo that drives the process is not yet known but it is possible that it uses the techniques that Bill Slawski detailed for Google’s recently approved patent Keywords associated with document categories. The results displayed, while often accurate, can, can still on occasion show unusual results. I thought that this screen shot captured some of those obviously weird results. Where exactly do you think these come from?  

Saturday, September 10, 2011

Final Days of 2011 Google Summer of Code

This summer has been an exciting one for the Google Summer of Code. We had 175 organizations participating this year, 48 of which were participating for the first time in the program. We also had 1115 students accepted into the program back in May.
Currently we are in the final week of this year's Google Summer of Code. Today, Monday August 15th, is our suggested ‘pencils down’ date. Students have a week to scrub their code, write tests, improve the documentation and perform any other recommendations their mentors might make before the firm end date of this year’s program - Monday, August 22nd.
For more information on our organizations or the projects students are working on you can visit our program site. Stay tuned for another post in the coming weeks with the final stats for this year's Google Summer of Code.

Thursday, September 8, 2011

The Garmin Homeport for Mac and PC


Garmin Homeport is a must-have trip-planning tool for mariners heading out on the open water. This planning software - now available on a Mac or PC - enables the use of existing BlueChart data from your preloaded chartplotter or pre-programmed card to help plot a course on your computer. You can then transfer this planned route back to your plotter and head out on your adventure. In addition to managing waypoints, routes and tracks, Homeport can also help you predict fuel usage, tides, depth profiles and more. You can also easily create point-to-point routes, determine distance and bearing measurements between checkpoints and calculate your estimated travel time for each leg of the journey. Homeport, $29.99, is available as a PC or Mac download, or on a microSD/SD card and is compatible with the following series: GPSMAP 400, GPSMAP 500, GPSMAP 600 (640 with BlueChart mapping only) GPSMAP 700, GPSMAP 3000 (trip planning only), GPSMAP 4000, GPSMAP 5000, GPSMAP 6000 and GPSMAP 7000.

Tuesday, September 6, 2011

Take your car off the road

Commuting to work without driving, meeting with someone on another continent without flying and riding cars without gasoline? It’s not a futuristic dream, but a way of life at Google. We support and encourage carbon-free commuting because it’s a vital part of our longstanding commitment to sustainability. We help take cars off of the road—not quite like the Hulk, but we are green. Back in 2004, one motivated Googler started a vanpool that ran from San Francisco to Mountain View as a 20 percent project. As demand grew, the program morphed into what is now one of the largest corporate shuttle services in the country. Today, up to a third of employees ride the GBus shuttles throughout our Bay Area offices five days a week—that’s more than 3,500 daily riders, or 7,000 one-way car trips avoided each day. Beyond the convenience and comfort that our shuttle rides offer—of which I’m reminded during my daily 35-mile commute from Alameda to Mountain View—they’re also environmentally friendly. Our shuttles have the cleanest diesel engines ever built and run on 5 percent bio-diesel, so they’re partly powered by renewable resources that help reduce our carbon footprint. In fact, we’re the first and largest company with a corporate transportation fleet using engines that meet the Environmental Protection Agency’s 2010 emission standards. Not only do we encourage self-powered commuting, we reward it. Googlers earn credits each time they get to work via alternative (non-engine) means—by bike, foot, skateboard or kayak. These credits are then translated into a dollar amount that gets donated—$100 for every 20 days of participation—to the Googler’s charity of choice. This year, 56 offices also participated in “Bike to Work Day,” with more than 2,500 Googlers who biked to work worldwide. The annual celebration is meant to reward daily cyclists as well as introduce many new riders to biking. The green life doesn’t stop once Googlers get to work. In Mountain View, our GBike system distributes about 1,000 bikes across the campus that Googlers can pick up whenever they have to get to another building. For longer distances and off-campus trips, we have the GFleet, our electric vehicle car share program, and our on-campus taxi service GRide. We're also installing hundreds of electric vehicle charging stations throughout several of our offices, making it easy for Googlers to charge up their own electric cars for free at work. If Googlers need to chat with their colleagues in other cities or continents they can use video conferencing technology, which cuts down on potential air travel. In total, the combination of the GFleet and our shuttles result in net annual savings of more than 5,400 metric tons of CO2. That's like taking over 2,000 cars off the road every day, or avoiding 14 million vehicle miles every year. With the help of Googlers, we’ll continue powering the wheels of sustainable transit innovation.

Using the Google Apps Profiles API

Domain administrators can create new users for their domain using the control panel web UI and the Google Apps Provisioning API. Once the new users are created, editing their contact information (such as their addresses, phone numbers, etc) can be done using the Google Apps Profiles API. These profiles are shown to everybody in the organization when searching for users in GMail’s Contacts Manager and GMail’s autocomplete feature. Some users want enhanced privacy but unsharing a user’s contact information could only be done using the control panel web UI. We just introduced a new element in the Google Apps Profiles API that lets domain administrators set this option programmatically. This new field is called gContact:status and is available under a User Profile entry:

Changing the indexed attribute value to false unshares the user contact’s information when “contact sharing” is enabled on the domain.

For more information about the Google Apps Profiles API and code samples for supported languages using our client libraries, please refer to the developer’s guide.

The Spatial Applications in Windows Azure

  Several other people have already written on the subject of writing an Azure application that makes use of the SQL Server spatial datatypes. See, for example, Johannes Kebeck’s or Rex Hansen’s articles. However, having tried to answer a question on this subject today, I noticed that both of these articles are a little out of date, or are not quite complete. So I thought I’d summarise the current steps involved in creating and deploying an application that makes use of the geometry and geography datatypes in an Azure application, including the steps involved if you want to use the new spatial features in SQL Server Denali. Note that I’m talking about Azure here, not SQL Azure (although that too can make use of spatial datatypes) – so, this is about using the same spatial functionality as in SQL Server but in a cloud-based application layer rather than in a cloud-based database layer.

What library(s) to use?

The spatial functionality in SQL Server comes provided courtesy of two libraries:
  • Microsoft.SqlServer.Types.dll – this is a (managed) .NET library that is installed in the /Program Files(x86)/Microsoft SQL Server/100/SDK/Assemblies subdirectory of a SQL Server installation and is registered in the GAC of any computer on which SQL Server has been installed.
  • SQLServerSpatial.dll – this is an (unmanaged) C++ library that can be found in the /Windows/System32 directory. In SQL Server Denali, the equivalent library is called SQLServerSpatial110.dll.
You need both the managed and unmanaged libraries to use spatial features, but getting them to work on Azure can be a bit tricky. The first thing is to make sure you use the 64-bit version of the libraries (since Azure runs on a 64-bit OS). Secondly, you need to make sure that you use the correct edition of the libraries. Although both SQL Server 2008 and SQL Server Denali x64 libraries work correctly, it appears that SQL Server 2008 R2 libraries have “a few compatibility problems” with Azure (as reported my MS staff in http://social.msdn.microsoft.com/Forums/en-GB/windowsazuretroubleshooting/thread/d5f3f43e-a5bf-4c44-9e99-4593e6f812fd). However, the R2 libraries offer no additional functionality over the SQL Server 2008 libraries anyway, so if you don’t want to use Denali you can just use the original SQL Server 2008 libraries instead.

Getting the Libraries

If you’ve already got a 64-bit version of either SQL Server 2008 or Denali on your machine, you can use the libraries installed with it in the locations described above. If not, the easiest way to get hold of compatible libraries is to download an x64 version of the SQL Server Feature Pack. Note that you can get hold of and use these libraries from the feature pack without ever needing to install SQL Server.
  • You can get the Oct 2008 x64 Feature Pack for SQL Server 2008 from here.
  • Or, if you want to use latest features such as support for curved geometry types, you can download the latest (CTP3) x64 Feature Pack for SQL Server Denali from here.
Once downloaded, extract the dll files from the appropriate .msi file using the following command:
msiexec /a SQLSysClrTypes.msi /qb TARGETDIR="C:/Temp"
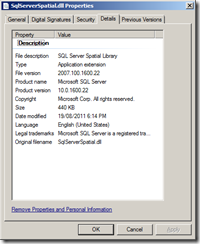
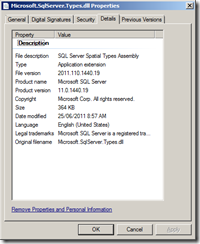
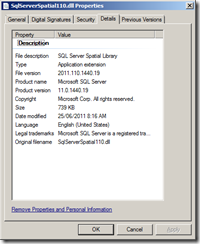
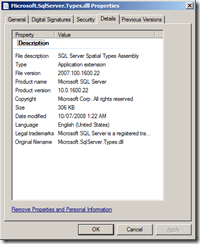
Within the C:Temp folder you should now find subfolders matching the directory structure described above each containing one of the dll files. You can check that you’ve got the right version of the files by comparing them to the details below:

SQL Server 2008
imageimage

Denali CTP3

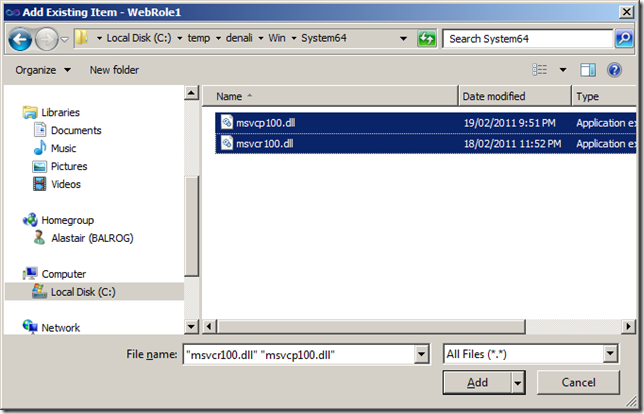
imageimage Note that, in addition to the libraries above, to make the Denali libraries work on Azure you’ll also need the msvcr100.dll and msvcp100.dll files installed in the Win/System64 directory.

Trust and Unmanaged Code

Prior to Windows Azure v1.2, the default trust level for Windows Azure applications was medium trust. That meant that, in order to use native unmanaged code libraries such as SqlServerSpatial.dll in an Azure application, you had to explicitly grant access by including the following property in the ServiceDefinition.csdef file:
enableNativeCodeExecution="true"
This step is described in Johannes’ article (which, remember, is 2 years old). However, since v1.2 (released June 2010) every Azure web role now runs under full trust, and can run native code by default (source: MSDN). Therefore no additional configuration changes are currently required to access the spatial libraries from your Azure application.

Step-By-Step Guide

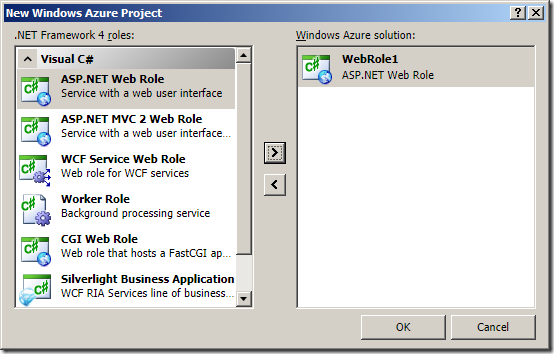
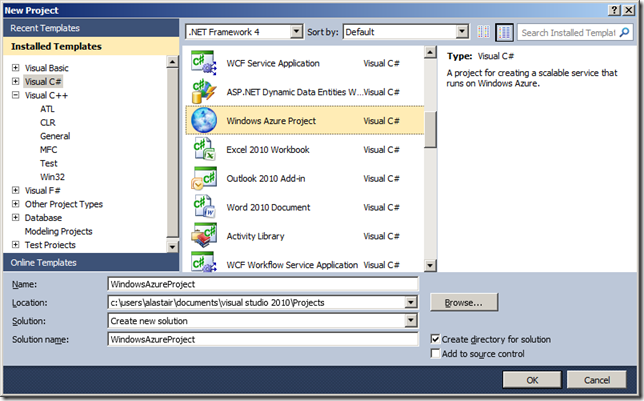
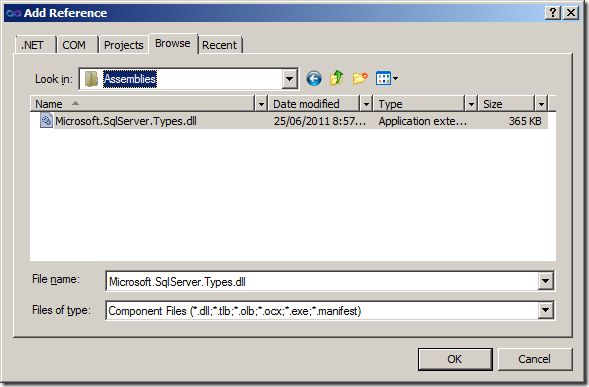
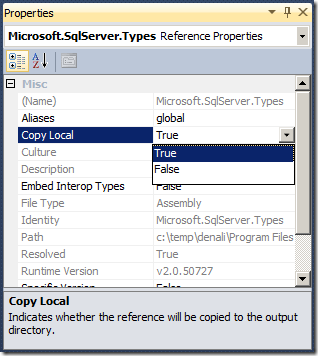
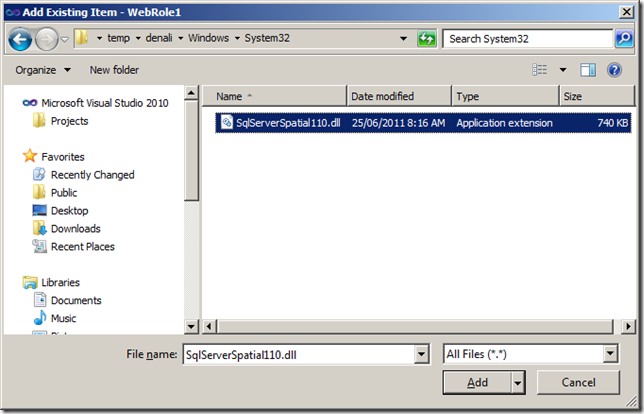
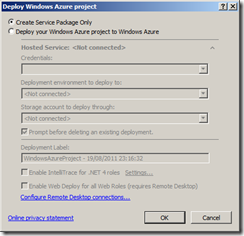
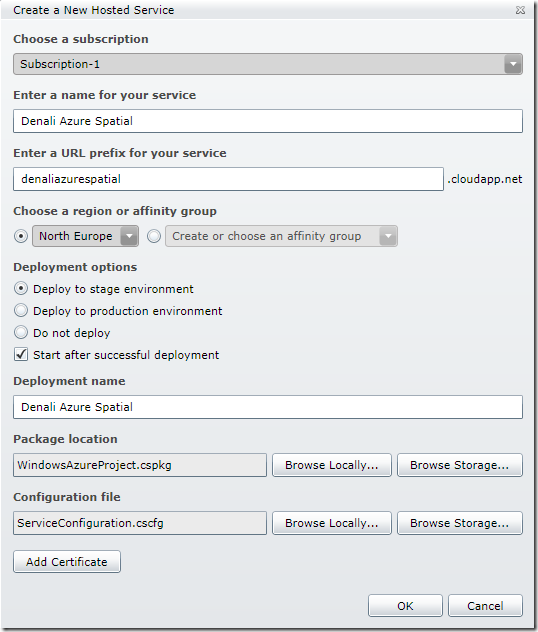
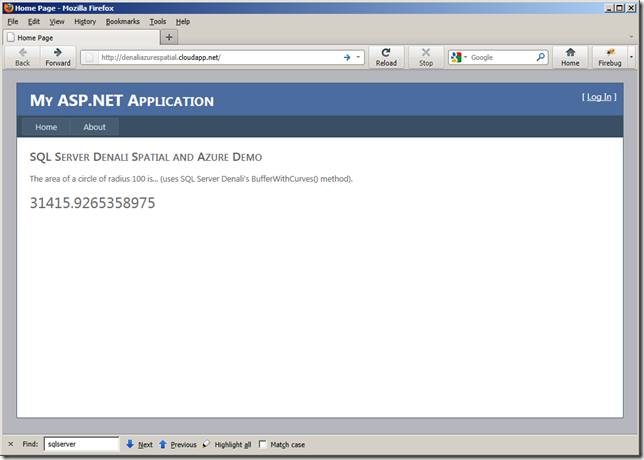
Having covered the points above that may have been missing from other guides, here’s a complete step-by-step guide to creating a spatial Azure application using the SQL Server Denali CTP3 spatial library. So, first of all, get hold of a copy of the 64-bit Microsoft® System CLR Types for SQL Server® code name ‘Denali’ CTP 3 from the CTP3 Feature Pack, and extract the dlls from it (or just install the .msi) as described above. All set? Then let’s go… 1. From Visual Studio 2010, create a new Windows Azure Project image 2. Add a web role to the project image 3. Select Project –> Add Reference and click the Browse tab to navigate to the directory in which you unpacked the spatial libraries. Add a reference to Microsoft.SqlServer.Types.dll, which can be found in Program Files (x86)Microsoft SQL Server110SDKAssembliesMicrosoft.SqlServer.Types.dll image 4. Change the properties of the Microsoft.SqlServer.Types library to “Copy Local = True” image 5. Select Project –> Add Existing Item and navigate to the /Windows/System32 directory. Then, add the SqlServerSpatial110.dll file. image 6. Select Project –> Add Existing Item again. This time, navigate to the /Win/System64 directory and highlight both the msvcp100.dll and msvcr100.dll files. image 7. Set the properties of msvcp100.dll, msvcr.dll and SqlServerSpatial110.dll to “Copy to Output directory = Copy always” image 8. The libraries are now ready to use, so write some code that makes use of them. Here’s a silly demo just to prove that I’m making use of a Denali spatial function, BufferWithCurves(). Firstly, edit the Default.aspx file as follows:
<%@ Page Title="Home Page" Language="C#" MasterPageFile="~/Site.master" AutoEventWireup="true"
    CodeBehind="Default.aspx.cs" Inherits="WebRole1._Default" %>

SQL Server Denali Spatial and Azure Demo

The area of a circle of radius 100 is... (uses SQL Server Denali's BufferWithCurves() method).
Then edit the Default.aspx.cs file to be as follows:
using System;
using System.Collections.Generic;
using System.Linq;
using System.Web;
using System.Web.UI;
using System.Web.UI.WebControls;

using Microsoft.SqlServer.Types;

namespace WebRole1
{
  public partial class _Default : System.Web.UI.Page
  {
    protected void Page_Load(object sender, EventArgs e)
    {
      Calculate_Area();
    }
    private void Calculate_Area()
    {
      SqlGeometry point = SqlGeometry.Point(0,0,0);
      SqlGeometry circle = point.BufferWithCurves(100);
      area.InnerText = circle.STArea().ToString();
    }
  }
}
9. Right-click on the Windows Azure project and select to Publish. In the following dialog, choose to Create Service Package only. image 10. Logon to the Windows Azure Management Portal. Create a New Hosted Service and enter the details of the service. In the Package Location and Configuration File boxes, select the .cspkg and .cscfg files created by Visual Studio in the bin/Debug/Publish directory of your project. image 11. Once the service has been created, navigate to the DNS of your new service and enjoy: image  
Sunday, September 4, 2011

Google Earth & hunt for treasure

The release of a new book The Great Global Treasure Hunt on Google Earth by Carlton Books. Filled with beautiful artwork, The Great Global Treasure Hunt allows you to take part in an interactive puzzle quest that could lead to a €50,000 prize. You can take part in a journey of discovery as the book works with Google Earth to reveal a series of textual and visual clues. Once you’ve made sense of each of these, a picture will begin to emerge leading you to a specific location on Google Earth. When you think you picked apart the clues set by the book’s puzzle master, Dedopulos, you can submit your answer online for your chance to win the €50,000 prize. One of Google Earth’s most notable attributes is its ability to facilitate a better understanding of the world around us. With more than 700 million activations, a new breed of “armchair explorers” with a thirst for information are using Google Earth to make new discoveries and enhance their understanding of our planet - and sometimes further afield. I’m really excited that this book uses Google Earth to add a 21st century technological twist to the world of mysteries and puzzles.

Thursday, September 1, 2011

The Worldwide Community of Mapping

The collective expertise of the Google Map Maker community has benefitted millions of people who use Google Maps. Users have helped put cities, road networks, and universities on the map for the first time in over 187 countries and regions. Now, users have the ability to contribute more than their mapping edits; they can also share their experiences, knowledge, and local expertise.
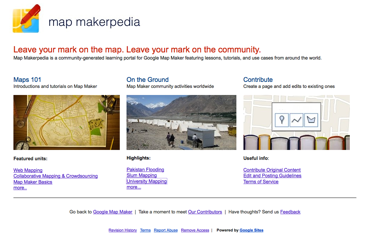
Map Makerpedia homepage
Map Makerpedia is a new crowdsourced guide for Google Map Maker that features lessons, articles, and tutorials. Alongside the Lat Long Blog and Map Your World community, Map Makerpedia is part of Google’s effort to highlight the contributions of individuals and organizations. Similar to a Wiki, the site allows users to both submit content and make edits. Students at the University of Ibadan in Nigeria are using Map Makerpedia to showcase their campus mapping project. Their contribution is more than a simple account of activities taking place but also contains information on event planning, preparation, and important challenges faced. These experiences serve as a guide for groups in other schools to follow, and these groups, in turn, can share their own experiences on the university mapping page.
Mapping in groups at the University of Ibadan in Nigeria
Map Makerpedia features a ‘Maps 101’ section, which puts Map Maker tutorials in a lesson-based form. Additionally ‘Map Maker on the Ground’ highlights the unique applications of the tool in the field, such as flood mapping in Pakistan, health mapping in Africa, and slum mapping across the world. Map Makerpedia was designed for flexibility and collaboration at all levels, from new submissions to revisions. The initial design and much of the original content was shaped by the Map Maker Advocates, as well as Dr. Rob Lemmens from ITC. Google Map Maker allows users to add and update geographic information for millions to see. Map Maker encourages users to make their mark on the map. Map Makerpedia enables users to build their Map Maker knowledge and also make their mark on the greater community.

Share This: