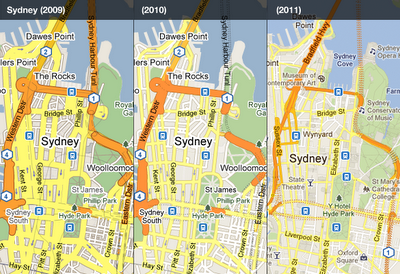
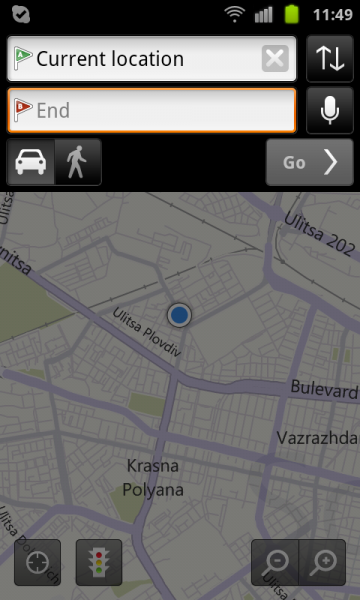
There is a good chance that you haven’t noticed subtle changes to cartographic design of Google Map that the company is continuously implementing. However, if you put different versions of Google Map side by side, it becomes very obvious how dramatically the appearance changed over the last few years. The key objective behind those changes is “… to make the map cleaner, more focused, more visually harmonious, and easier to use.”
“…Some highlights to look out for are a brighter and more cheerful colour palette, a more integrated and less visually noisy labelling style, subtle improvements to footpaths and minor roads, and cleaner building and land parcel rendering.”
One thing Google cannot be accused of is that it does not put continuous efforts into upgrading of its products and services. In fact, that constant tinkering with features and functionality gives an impression that all Google products are in a permanent state of development. With Google we never know what functionality is coming and when it will be available, or whether the product or service will survive in the long run as the company is not afraid to pull down underperforming applications. The most recent announcement is the closure of Google Labs with 56 experimental products. Product-specific Labs sites, like Gmail Labs, Google Maps Labs and Search Experiments, aren't affected by the decision.
First spotted on Google Maps Mania
Tuesday, August 30, 2011
Monday, August 29, 2011
Google has been slowly rolling out their “Get Your Business Online”
Google has been slowly rolling out their “Get Your Business Online” free seminar/website initiative worldwide. They first offered a similar program to SMBs in the UK in February 2010. Earlier this year, Google rolled out the program in Ireland and Canada and apparently updated their UK program. Some of the programs have had some fine print but the most recent incarnations seem to offer real value for those businesses that want a minimal and easy to start web presence.
In July of this year Google offered up the first US based “Get Your Business Online” in Texas in conjunction with regional and national partners. Their national partners include Intuit, the Association of Small Business Development Centers, SCORE, and Meetup. The website offered as part of the package (with one year free domain) is a 3 page only version of Intuit’s Websites SiteBuilder. The Intuit commercial product is a 5 page site and costs $7.99/month.
Last week Google offered the seminar/free website program in Burlington and Rutland, Vermont. The kick off seminars in Vermont were done with a large number of not for profit agencies and business development groups including the Lake Champlain Regional Chamber of Commerce, the Vermont Agency of Commerce and Community Development, the Vermont Small Business Development Center Network and others.
With the domains Texasgetonline.com & Vermontgetonline.com and on the ground programs in those two states it seemed possible that Google would be rolling the seminar and free website program nationwide on a state by state basis. On June 25, Google apparently transferred 100 domains to their servers in the format StateGetOnline.com & GetStateOnline for most of the 50 states and an additional overarching domain USGetOnline.com. While the move is certainly a defensive domain acquisition/protection strategy, it seems equally likely that free website program could soon be rolling out nationally.
Minimally the effort should put to rest speculation that Google just wants businesses to have a Places/Google+ pages on their servers and no independent web presence.
Here is a complete list of the domains transferred to Google at the end of June:
domain |
alabamagetonline.com |
alaskagetonline.com |
americagetonline.com |
arizonagetonline.com |
arkansasgetonline.com |
californiagetonline.com |
carolinagetonline.com |
carolinasgetonline.com |
coloradogetonline.com |
connecticutgetonline.com |
dakotagetonline.com |
dakotasgetonline.com |
delawaregetonline.com |
floridagetonline.com |
georgiagetonline.com |
getalabamaonline.com |
getalaskaonline.com |
getamericaonline.com |
getarkansasonline.com |
getcarolinaonline.com |
getcarolinasonline.com |
getcoloradoonline.com |
getconnecticutonline.com |
getdakotaonline.com |
getdakotasonline.com |
getdelawareonline.com |
getgeorgiaonline.com |
gethawaiionline.com |
getidahoonline.com |
getindianaonline.com |
getiowaonline.com |
getkentuckyonline.com |
getlouisianaonline.com |
getmaineonline.com |
getmarylandonline.com |
getmassachusettsonline.com |
getmichiganonline.com |
getminnesotaonline.com |
getmississippionline.com |
getmissourionline.com |
getmontanaonline.com |
getnebraskaonline.com |
getnevadaonline.com |
getnewhampshireonline.com |
getnewjerseyonline.com |
getnewmexicoonline.com |
getnorthcarolinaonline.com |
getnorthdakotaonline.com |
getoregononline.com |
getpennsylvaniaonline.com |
getrhodeislandonline.com |
getsouthcarolinaonline.com |
getsouthdakotaonline.com |
gettennesseeonline.com |
getutahonline.com |
getvermontonline.com |
getvirginiaonline.com |
getwestvirginiaonline.com |
getwisconsinonline.com |
getwyomingonline.com |
hawaiigetonline.com |
idahogetonline.com |
illinoisgetonline.com |
indianagetonline.com |
iowagetonline.com |
kansasgetonline.com |
kentuckygetonline.com |
louisianagetonline.com |
mainegetonline.com |
marylandgetonline.com |
massachusettsgetonline.com |
michigangetonline.com |
minnesotagetonline.com |
mississippigetonline.com |
missourigetonline.com |
montanagetonline.com |
nebraskagetonline.com |
nevadagetonline.com |
newhampshiregetonline.com |
newjerseygetonline.com |
newmexicogetonline.com |
newyorkgetonline.com |
northcarolinagetonline.com |
northdakotagetonline.com |
ohiogetonline.com |
oklahomagetonline.com |
oregongetonline.com |
pennsylvaniagetonline.com |
rhodeislandgetonline.com |
southcarolinagetonline.com |
southdakotagetonline.com |
tennesseegetonline.com |
texasgetonline.com |
usgetonline.com |
utahgetonline.com |
vermontgetonline.com |
virginiagetonline.com |
washingtongetonline.com |
westvirginiagetonline.com |
wisconsingetonline.com |
wyominggetonline.com |
Mapping Hurricane
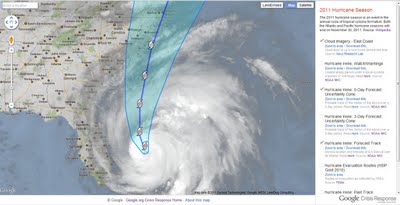
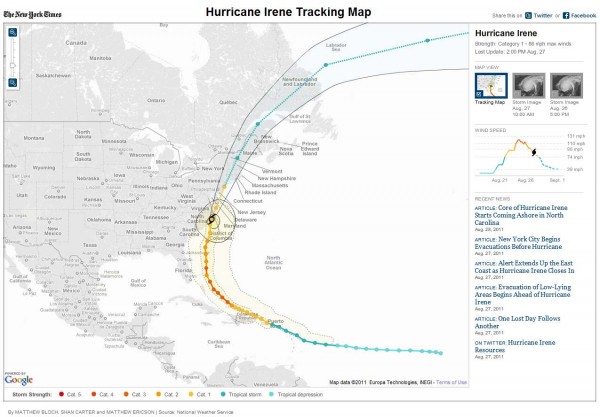
With Hurricane Irene headed towards the East Coast of the United States, the Google Crisis Response team has assembled a collection of map data to help you keep track of the storm. From this map, you’re able to get most recent hurricane-related information from such sources as NOAA’s National Hurricane Center and FEMA.
To help explore this information, we’ve created the Google Crisis Map, a map viewer with the latest available geographic information. Here’s some more information about the map’s content and features:
- Google Crisis Map always shows the latest, valuable information we've been able to uncover on the most current situation
- You can zoom and pan the map using the on-screen controls, and turn layers of information on or off just by clicking
- You can find out more about the map layers by visiting the linked websites of the content owners
- The site is optimized for mobile, so you can look at the map on a mobile phone as well as your desktop
- You can also share the map, or embed it on your website or blog by clicking share to find the URL and HTML code
Hurricane Irene map viewer
To provide feedback or comments on the map, or if you’re aware of map layers or other datasets that you would like to see included on our maps, please submit them for our consideration at google.org/crisismap. We’ll continue to update the Crisis Response website with other valuable resources on Hurricane Irene and relevant preparedness tips.
Saturday, August 27, 2011
Friday, August 26, 2011
Google Maps: Available on new country domains
Here at Google our goal is to make all the world’s information accessible and useful; providing relevant local data to each country has been the heart of what motivates us on the Google Maps team.
Back in 2005 we started with one domain, .com, and now almost six years later we are happy to announce today that we are adding more than 40 new domains on Google Maps. In total we have more than 130 countries with their customized maps domains and we support 60+ user interface languages.
A Maps domain is a customized entry point to our maps, tailored for a particular country, which makes searches for places and localities in the country more efficient. For example when someone in Argentina searches for “Córdoba” we know that he probably meant the one in Argentina and not the other Córdoba in Spain.
This means that whether you are in Sri Lanka, Venezuela or Cameroon you will have now a unique domain to get directions, local information and find new favorite places.
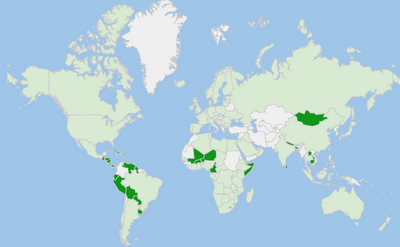
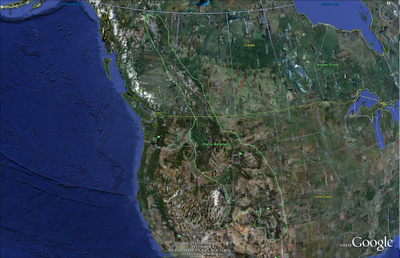
We’ve highlighted in the map below where we have added new domains:
New country domains are in dark green
Sandboxed native code to Chrome Web Store
Wouldn’t it be great if you could create web apps using your existing C and C++ code? Native Client lets you do just that, and it is now enabled for Chrome Web Store apps in Google Chrome’s beta channel.
Native Client apps live on the web platform, so you don’t need to create separate versions of your app for each operating system. Rather than relying on OS-specific APIs, Native Client apps use Pepper, a set of interfaces that provide C and C++ bindings to the capabilities of HTML5. This means that once you’ve ported your code to Native Client, it will work across different operating systems, and you only need to maintain one code base.
Today Native Client supports the Pepper APIs for 2D graphics, stereo audio, URL fetching, sandboxed local file access (File API), and asynchronous message passing to and from JavaScript. In future releases we will be adding support for hardware accelerated 3D graphics (OpenGL ES 2.0), fullscreen mode, networking (WebSockets and peer-to-peer connections), and much more. As new capabilities are added to HTML5 and Pepper, they will become available to Native Client.
This functionality does not come at the expense of security. To ensure that Native Client is as safe as JavaScript, Native Client code is isolated from the operating system by two nested security sandboxes: the Native Client sandbox and the Chrome sandbox. And unlike NPAPI plugins or ActiveX controls, Native Client apps do not have access to the underlying OS APIs.
We encourage you to start developing apps with Native Client. You can download the SDK and find tutorials, examples, API documentation, and our FAQ on the Native Client site. Once version 14 of Chrome hits stable channel, you’ll be able to upload your Native Client apps to the Chrome Web Store, where you can reach Chrome’s 160 million users.
The next milestone for Native Client is architecture independence: Portable Native Client (PNaCl) will achieve this by using LLVM bitcode as the basis for the distribution format for Native Client content, translating it to the actual target instruction set before running. Until then the Chrome Web Store will be the only distribution channel for Native Client apps. This will help us ensure that all Native Client apps are updated to PNaCl when it’s ready – and in the meantime avoid the spread of instruction set architecture dependent apps on the web.
Thursday, August 25, 2011
Igor Rasteryaev- Cossack song
The song named «Cossack song».
A warm wind was flying оn the field,
walking, snooping and then
This wind flew in through the window and whispered to me about.
Very many dusky guys just tonight
as screaming by Turkic, they're coming to us so as to hack at all of us.
I'm only fifteen but I've smelt death and powder,
I cut away a human head as easy as a sunflower hat.
Don't risk fighting against these kids in a sabre battlefield,
I striked alone against twelve.
They're just appeared far away,
Their dusky leader has animal grin.
What do you forget on the river
That named the Free Medveditsa!
You must cover yourself in the battlefield
By my own child's perception
I'm singing to you in Russian,
But I can sing in Turkish if you want!
Come closer, guys, let's go!
I'm wholly openhearted as though bare.
My lance is my round loaf.
Who has gaped -- that will be dead at once!
Hurra-hurra-hurra-hurra -- kor!
I'm hearing Turkish screaming.
Now that braggart will be
striked down in his head by my steel sabre!
Wednesday, August 24, 2011
Street View imagery in Iraq's National Museum
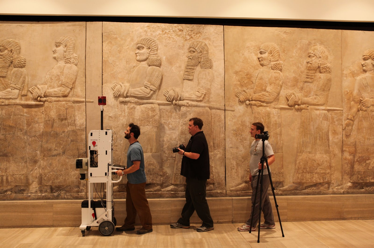
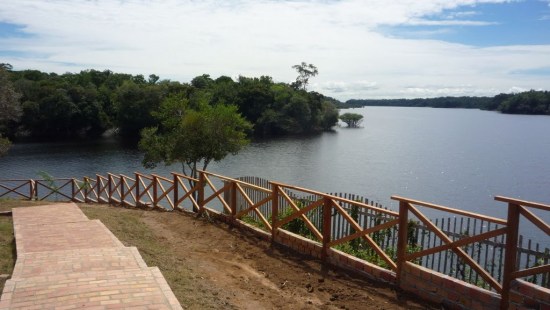
Google is hard at work expanding their Street View coverage. They recently released imagery for the interior of Iraq's National Museum and they're hard at work capturing great imagery along the Amazon.
We've seen Google use a variety of equipment to capture imagery around the world, including a trike for outdoor paths and a snowmobile for ski slopes. Now they're introducing us to a few more: the trolley (seen below) was used to help capture imagery in the museum and they have a boat-mounted system to capture imagery along the Amazon river. Here's what the trolley looks like:
You can take a look around inside the museum by using this link.
Google's other Street View news is about the new imagery they're currently acquiring along the Amazon river. They're using the StreetView trike and the new boat-mounted Street View camera to capture the imagery there. No release date has been set for it, but we'll certainly keep you posted. This will be a wonderful resource to have available, not only for us digital explorers but also for educational settings.
Don't forget that you can use Street View inside of Google Earth. As you know, this feature was greatly enhanced with the release of Google Earth 6, making it much easier to browse this kind of imagery from within Google Earth. To enter one of these areas, or any other Street View-enabled location, simply drag the "Peg Man" from the controls in the upper right corner onto the globe.
It is an all too familiar situation when you get home from a bike ride and wonder aloud, "I am exhausted, exactly how far did I just go?" or: "I was flying down that hill, I swear I must have been going 30 mph!" Well, now we give you an affordable solution to know those answers during and after your ride.
Today we announced the Edge 200 GPS enabled cycling computer. Lightweight and stylish, the Edge 200 features a high-sensitivity GPS receiver, requires no calibration, can be switched quickly and easily between bikes and can be used in all types of weather.
“The Edge 200 was designed for those budget conscious cyclists looking for the basics — speed, distance, time and calories,” said Dan Bartel, Garmin’s vice president of worldwide sales. “With no set-up or sensors required, simply switch on, press start and go. The Edge 200 adds so much to your ride that no ride will ever be the same again.”
Whether you ride for fun, fitness or to feed your competitive edge, users will love seeing how far and how fast they rode — all without wires and sensors. Edge 200 stores up to 130 hours of ride data and sorts activities to quickly look up the fastest, longest or last ride – providing motivation and inspiration that’ll keep cyclists on track. With a 14 hour battery life, Edge 200 features a USB interface for easy charging and data transfer.
Weighing a mere 2 ounces, the Edge 200 is both lightweight and affordable. It features a high-sensitivity GPS receiver with HotFix® satellite prediction – meaning there’s less time spent waiting and more time spent riding. The Edge 200 also allows users to set alerts for distance, time or calories to make it easier and more fun to achieve their goals.
The Edge 200 helps cyclists bring new life to old rides with Courses, a feature that lets riders challenge their times on previous rides. A digital cyclist shows their speed relative to past performance, along with an indication of how far ahead or behind they are. These can be taken from rides stored on the Edge or downloaded from the huge and expanding Garmin Connect™ community (http://connect.garmin.com). Here users can quickly and easily log their rides, track their totals, set goals, share rides with friends and family and participate in an online fitness community of more than 70 million activities around the world. Garmin Connect displays metrics such as time, distance, pace, and elevation. This information is shown through charts, illustrations, reports and a variety of map representations including street, photo, topographic, and elevation maps. Use Garmin Connect’s new Course Creator feature to plan new rides or convert a past activity into a Course.
Wednesday, August 17, 2011
Using maps in the Horn of Africa
From the 2007 Crisis in Darfur map to the Sudan mapping earlier this year, more and more people are finding ways to use geospatial technologies to aid others around the world.
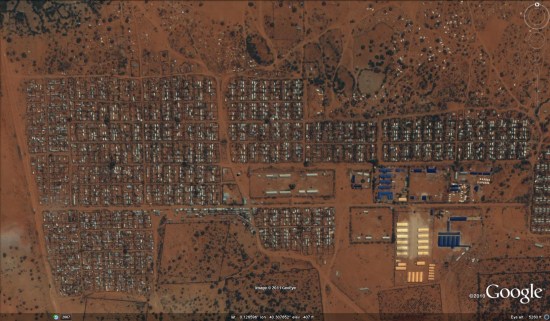
There is currently a severe famine in the Horn of Africa, and it's predicted to get worse in the coming months. To help reach people with the greatest need, Google is trying to assemble more data in the hardest hit areas. To start, GeoEye has been capturing high resolution imagery of various areas that have the greatest need, and the imagery can be explored with this KML file.
Going further, Google is asking users to contribute local data if they are familiar with any of the stricken areas. Any data that can be added, such as roads, schools and hospitals, would be very beneficial. If you're able to help, consider joining their Africa mailing list or check out the Horn of Africa community mapping site.
Saturday, August 13, 2011
Microsoft's Bing Maps for Android
Microsoft's Bing for Android may not technically be the first Microsoft-made app for Android phones (that honor belongs to the rather obscure Microsoft Tag Reader,) but the Bing is its highest-profile app.
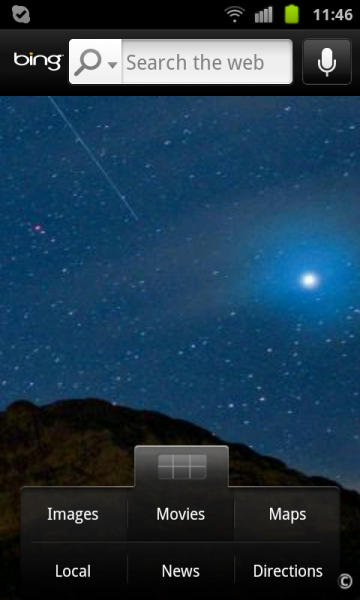
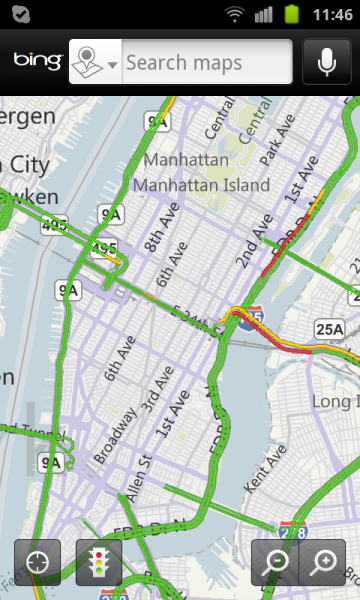
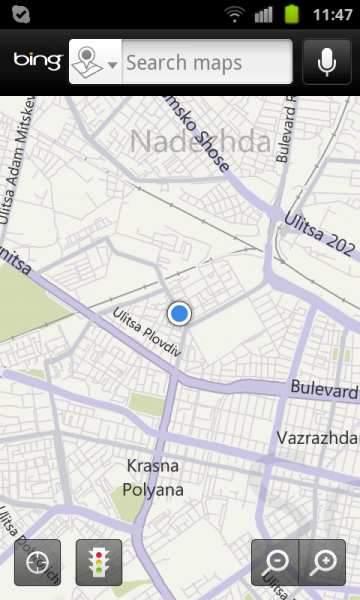
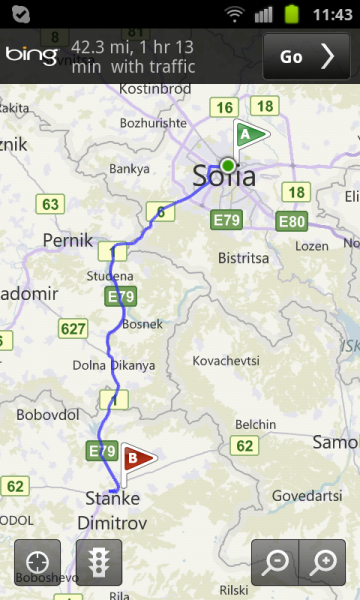
Bing for Android closely resembles Bing for iPhone, with an image of the day marking the backdrop, and a pop-up menu to search by images, movies, maps, news, or what's nearby. There's also an option for directions. A search field sits at the top, next to a voice search button. Bing for Android hides your history, settings, and favorites in the phone's hard-coded Menu button.
The Android version of Bing also integrates maps, and the touchable hot spots hidden in the day's image that reveal additional information about the photo du jour. Swiping backward loads previous images.
However, Bing for Android lacks two significant features found in the iPhone version-options for scanning an item's bar code with your camera, and connecting to your Twitter and Facebook feeds.
We're fans of the Bing app on all platforms we've tested, and while we'd like to see this Android version gain parity with the iPhone version, usabilitywise, it's no exception. We'd also like to see the Maps portion add directions for public transit--a la Google Maps-to complement its driving and walking directions.
Thursday, August 11, 2011
Google Earth's land art
Whether you’re an art lover or a Google Earth explorer (or both!), you’ll appreciate a new tour that highlights pieces from what’s known to be the largest contemporary land art undertaking in the world.
The Rhythms of Life project, by internationally renowned Australian sculptor Andrew Rogers, comprises 47 structures built over 13 years. The installations are found in 13 countries and were created with the help of 6,700 local people. Known as geoglyphs, these structures are built in exotic disparate locations including deserts, fjords, gorges, national parks and altiplano, with local materials by local people. They are so large they can be easily observed in Google Earth’s satellite imagery.
Andrew’s inspiration for this project was the interconnectedness of community and the environment, citing that the connected drawings on the surface of the Earth refer to the physical building blocks of history and civilization. He aims to establish communal structures for the purpose of ceremony and historical reflection with the local people.
The video below will take you on a tour of this project. You will discover land art in Sri Lanka, China, Bolivia, and Iceland. Andrew has also built sculptures more recently in Antarctica, Kenya, and Turkey and these pieces will be added to the tour in the future.
Tour video is also available at andrewrogers.org.
To view this tour in Google Earth, please download the KML file.
Wednesday, August 10, 2011
Determining the Spatial Features in a SQL Server Table
I’ve been using the SQL Server Denali CTP(s) for just over 6 months now. As a result, I’ve become accustomed to some of the new features and forget that they aren’t generally available in production environments yet… it always comes as a bit of a surprise when you have to do some work on a SQL Server 2008/R2 database and suddenly discover half of the feature you’ve come to rely on aren’t there any more (I pity those consultants who turn up at a client’s site to find SQL Server 2000/7/6.5 instances – fortunately, if you’re dealing with spatial data, this doesn’t really happen
One such example happened today, when I was trying to determine the extent of the features in a column of spatial data, in order to create a bounding box for a spatial index covering all the data. In SQL Server Denali, this can be done very easily using an EnvelopeAggregate. Although not documented, any envelope created by SQL Server (i.e. using STEnvelope() or EnvelopeAggregate()) will be always have its first point at the bottom left of the envelope, and its third point at the opposing, top right corner. You can therefore calculate the minimum and maximum extents of the features in the MyGeomColumn of geometry data as follows:
SELECT geometry::EnvelopeAggregate(MyGeomColumn).STPointN(1).STX AS MinX, geometry::EnvelopeAggregate(MyGeomColumn).STPointN(1).STY AS MinY, geometry::EnvelopeAggregate(MyGeomColumn).STPointN(3).STX AS MaxX, geometry::EnvelopeAggregate(MyGeomColumn).STPointN(3).STY AS MaxX FROM BigOlTableOfData;
Option #1 : With a Cursor
Well, you could come up with your own envelope aggregate using a (dreaded) cursor. Something like this:DECLARE @geom geometry, @geomaggregate geometry = 'GEOMETRYCOLLECTION EMPTY'; DECLARE @i int = 0; DECALRE geocursor cursor fast_forward FOR SELECT MyGeomColumn FROM BigOlTableOfData; OPEN geoCursor; FETCH NEXT FROM geoCursor INTO @geom; WHILE @@FETCH_STATUS = 0 BEGIN SET @geomaggregate = @geomagregate.STUnion(@geom); FETCH NEXT FROM geoCursor INTO @geom; SET @i += 1; END; CLOSE geocursor; deallocate geoCursor;
Option #2 : CLR Function
Alternatively, you could choose not to explicitly create the envelope, but create a CLR function that looped through all the points of each geometry (using STPointN() and STNumPoints()) , and keep track of the minimum and maximum X and Y values in the loop. Something like this:double xMin = double.MaxValue; double xMax = double.MinValue; double yMin = double.MaxValue; double yMax = double.MinValue; // Loop through each geometry in the dataset foreach(SqlGeometry geom in MyGeomColumn) { // Loop through each point in this geometry for(int i=1; i<= geom.STNumPoints(); i++) { SqlGeometry point = geom.STPointN(i); // Check whether this point is a new min/max value if (point.X < xMin) { xMin = point.X; } else if (point.X > xMax) { xMax = point.X; } if (point.Y < yMin) { yMin = point.Y; } else if (point.Y > yMax) { yMax = point.Y; } } }
Option #3 : CTE
Here’s a nice alternative using two CTEs, which I first saw described here. The first CTE creates a table, ENVELOPE, containing the individual envelopes of each feature in the table. The second table selects just the corner points of each of those envelopes, with a UNION ALL query (note that this is a regular UNION, not a STUnion()).Then, you simply select the minimum and maximum X and Y values of any of the points listed in the CORNERS table:
WITH ENVELOPE as ( SELECT MyGeomColumn.STEnvelope() as envelope from BigOlTableOfData ), CORNERS as ( SELECT envelope.STPointN(1) as point from ENVELOPE UNION ALL select envelope.STPointN(3) from ENVELOPE ) SELECT MIN(point.STX) as MinX, MIN(point.STY) as MinY, MAX(point.STX) as MaxX, MAX(point.STY) as MaxY FROM CORNERS;
Option #4 : Persisted Envelopes
Another option, and the one I chose to use today, is to alter your table structure to include computed columns containing the minimum and maximum X and Y values of the envelope around each feature on a per-row basis. I chose to make my columns PERSISTED, so that the computed values would actually be materialised and saved in the database rather than computed on-the-fly:ALTER TABLE BigOlTableOfData ADD MinX AS (CONVERT(int, MyGeomColumn.STEnvelope().STPointN((1)).STX, 0)) PERSISTED, MinY AS (CONVERT(int, MyGeomColumn.STEnvelope().STPointN((1)).STY, 0)) PERSISTED, MaxX AS (CONVERT(int, MyGeomColumn.STEnvelope().STPointN((3)).STX, 0)) PERSISTED, MaxY AS (CONVERT(int, MyGeomColumn.STEnvelope().STPointN((3)).STY, 0)) PERSISTED;
SELECT MIN(MinX) AS MinX, MIN(MinY) AS MinY, MAX(MaxX) AS MaxX, MAX(MaxY) AS MaxY;
Monday, August 8, 2011
Hit by Competitor Spam Reviews
I seem to be mired in competitor spam reviews these days. The second bad review in as many weeks showed up this weekend on Barbara Oliver & Co. Jewelry’s Place Page. At first glance it appeared legit. The complaint, that it is pretentious to require appointments, is untrue and probably comes from a misreading of Barbara’s recently placed announcement on her website. She noted that during renovations and expansion construction from the 12th to 24th of this month she would be closed except by appointment.
The second review made an owner- response to both negative reviews imperative. I had not previously responded to the original bad review thinking that the reviewer might go silent. That did not happen. I think Puresheer and EarlPearl are right in that sense… the spammer is unlikely to go away and defend our honor we must.
The answer I chose to use was Kevin Baca’s (of Customer Lobby) excellent edit of my original response. I modified it slightly (per CathyR’s suggestion) and removed the words “fake review” to avoid a Google snippet disaster.
This is Barbara Oliver, owner of the company. You are right in that there are business owners out there faking reviews. I’m from the old school of small business ethics that insists on earning a good reputation over time with excellent customer service. I give my word that the reviews here on my Place Page are 100% legitimate and left by my real customers. I personally remember each of the wonderful transactions they are mentioning. As you can imagine, we really appreciate the time they took to do this. I invite you to come to our shop to see for yourself our beautiful jewelry, fair pricing and the fabulous shopping experience we provide for each of our valued customers. Barbara
The “perp” though, while trying to be sneakier and leaving a seemingly real second review, seems to have tipped their hand. I was actually “buying” their review of Barbara and Andrews Jewelers until I got to the marketing happy talk left on behalf of the third jeweler.
Responding to the appointment critique was much easier and offered the opportunity to both differentiate Barbara’s services and extol her expansion. The problem is though that it appears that the writer is developing a taste for this sort of thing, however small time. Should we contact the other jewelers in question and initiate a dialogue? Should we ust keep responding and ignore the likely source knowing that they are adding to our review count?
Thursday, August 4, 2011
Android Developer Labs 2011
We in Android Developer Relations have been cooking up a rather special set of Android Developer Labs (ADLs) for the second half of 2011, and we’re ready to start the ball rolling.
Here’s the schedule. These are one-day events, so in Seattle and New York we’re running it twice for two audiences.
- Bangalore — August 2 (happening today)
- Seattle — August 15 and 16
- New York — August 23 and 24
- Los Angeles — September 2
Registration is a two-step process. Anyone can register, but we can only accommodate a relatively small number of attendees from among the registrants, based on whether they already have an Android app with the potential to be a top-tier tablet app in terms of quality, fit, and finish. The goal is to bring your app to the ADL, and leave equipped to make it into one that makes Android tablet users smile.
Westport: The Town of Tomorrow
Westport, Ireland has been holding the Town of Tomorrow competition for a few years now. As the name implies, the competition is about designing a futuristic version of Westport town with Google SketchUp. For this year’s competition, we flew out to Ireland to train students in basic SketchUp modeling techniques.
Students experimenting with SketchUp.
After the training, students spent two and a half months developing their visions of what Westport should look like in the future. We then selected winners based on how innovative, creative, and practical the design was. Many of the students incorporated themes of green technology, renewable energy, and sustainability into their projects.
The winning design from the Electric Spoon Parade team!
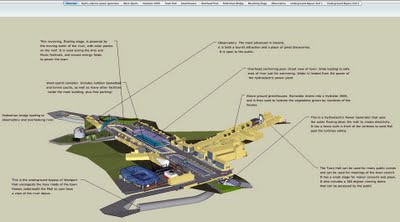
This year’s winning design came from the Electric Spoon Parade team and was based predominately on the use of converting the town’s canals to hydroelectric power generators. There were also other water catchment systems set up around the town to collect rain water for greenhouse use and filtered for consumption at a newly designed sports complex. Other important attributes include an underground bypass for automobile traffic and a pedestrian bridge.
Photo courtesy of Conor McKeown
We held a celebration to announce the winners and awarded everyone a variety of fun Google gear, notably the sweet shades the participants are sporting in the photo above. The Town Council of Westport also generously provided gift cards to all the members of the winning teams.
Wednesday, August 3, 2011
New large geographic features in Google Earth
Since announcing the "Mountains" layer in April, we’ve been busy working to bring you additional geographic features in Google Earth. Today we’re announcing the availability of mountain ranges, deserts, plains and more under the “Borders and Labels” left Layers panel.
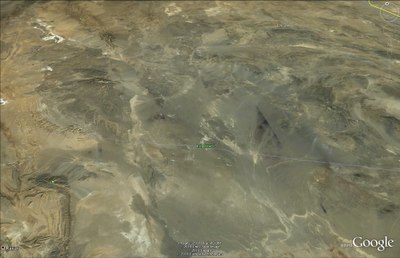
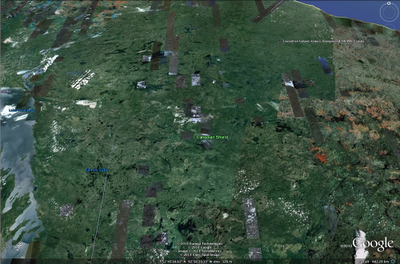
Along with well-known landmarks such as the Appalachian Mountains, the Alps and the Sahara Desert, you’ll also find some less-well-known (but just as interesting) features, including the Lut Desert in southeastern Iran (one of the hottest areas on Earth) and the Canadian Shield in central and eastern Canada (a very large area in where glaciers removed much of the topsoil starting around 4.5 billion years ago).
Knowing that a single label may not do justice to expansive areas such as the Rocky Mountains, we’ve also enabled “mouseover” extents for these geographic features. By simply moving your mouse over the label you can see the full extent of larger formations or regions.
Along with well-known landmarks such as the Appalachian Mountains, the Alps and the Sahara Desert, you’ll also find some less-well-known (but just as interesting) features, including the Lut Desert in southeastern Iran (one of the hottest areas on Earth) and the Canadian Shield in central and eastern Canada (a very large area in where glaciers removed much of the topsoil starting around 4.5 billion years ago).
Lut Desert in southeastern Iran
Canadian Shield in central and eastern Canada
To view these and all the other newly-added features, make sure “Borders and Labels” box is checked in the left Layers panel in Google Earth and look for the green labels.Knowing that a single label may not do justice to expansive areas such as the Rocky Mountains, we’ve also enabled “mouseover” extents for these geographic features. By simply moving your mouse over the label you can see the full extent of larger formations or regions.
Mouseover extent of the Rocky Mountains
We hope this addition makes it easier for you to explore the world’s greatest natural features.
Google Tasks Porter
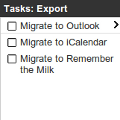
The Data Liberation Front is a team within Google dedicated to making sure users can get their information in and out of Google products. As part of that effort, we are happy to announce a new open source product called Google Tasks Porter. Google Tasks Porter is an application that allows you to import and export your Google Tasks.
Google Tasks Porter is designed with other applications that contain task lists in mind. It supports import and export via the iCalendar format which is used by a variety of applications, including iCalendar itself. It also supports import and export to Microsoft Outlook via a CSV format. Additionally, Google Tasks Porter supports export from Remember the Milk using its iCalendar export, and import to Remember the Milk via email. You can also download a list of all your tasks in an HTML format which is designed to be portable and parseable.
Google Tasks Porter allows you to create a set of "snapshots" of your data, each representing a list of all your tasks at a particular point in time. You can then save or delete these snapshots, and you can export a snapshot at any time to another application using any of the available formats. You can also upload an ics or csv file in order to import the tasks contained therein into Google Tasks.
The application is available on the web at http://google-tasks-porter.appspot.com. The source code is also available on Google Code at http://google-tasks-porter.googlecode.com using the Apache License, Version 2.0. Please try the application out and let us know what you think. You can provide feedback via the mailing list at google-tasks-porter@googlegroups.com.
Tuesday, August 2, 2011
New Zealand 1:50,000 Topo Maps
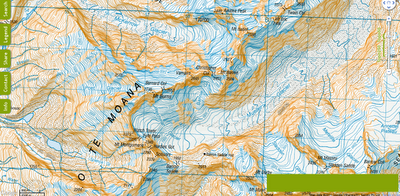
New Zealand Topo Map
New Zealand Topo Map is an interactive topographic map of New Zealand using the official LINZ's 1:50,000 / Topo50 and 1:250,000 / Topo250 maps.http://mapsys.info/wp-content/uploads/2011/06/dd7a9b98d8blank.gif.gif
http://www.topomap.co.nz/NZTopoMap/9432/Vampire/Westland
Lord of the Rings (and The Hobbit 2012) Fans will be interested in
http://www.topomap.co.nz/NZTopoMap/7770/Lindis%20Pass/Otago
Monday, August 1, 2011
The 2011 Atlantic and Pacific hurricane season
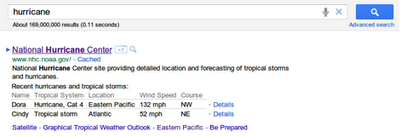
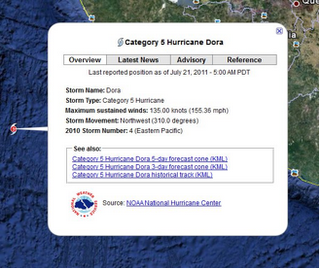
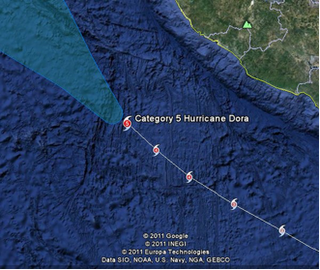
With the fourth major storm of the 2011 Pacific Hurricane season, Category 5 Hurricane Dora, churning off of Mexico’s Pacific coast, it’s looking like 2011 will be an active year for tropical storms. Today we’d like to introduce some new tools for tracking tropical storms across Google products.
The first new way to get information about current tropical storms is on Google Search, where you can enter “hurricane” (or related terms such as “tropical storm”) and get the latest Atlantic and Pacific tropical storm information courtesy of NOAA’s National Hurricane Center. From the list of results associated with Hurricane Center, you’ll find the storm name, the storm type, latest speed and storm direction. Clicking the “Details” link will take you directly to the National Hurricane Center’s page for a specific storm.
You can also keep track of the current tropical storms through Google Earth, where we’ve made tropical storms part of the “default-on” Earth experience (just make sure “Places” is checked in the left Layers panel).
In addition to presenting National Hurricane Center storm data for the the Atlantic and Pacific, we’re also displaying tropical storm information (typhoons, cyclones, etc.) for several other storm-prone water bodies, such as the Indian Ocean and the Tasman Sea with data courtesy of the World Meteorological Organization (WMO).
Hurricane Dora in Google Earth
In Google Earth, you’ll find information on a storm’s intensity, heading, as well as the latest news and advisory information. Where available, we also provide links to download the historical and forecasted storm positions as a KML file. Be sure to turn on the “Clouds” layer under the “Weather” menu in the left Layers panel to visualize the magnitude of each storm.The latest storm information for Hurricane Dora in Google Earth.
Historical and forecasted storm positions for Hurricane Dora in Google Earth.
We hope these new hurricane tracking tools will keep you informed about the latest storms in your area and around the world.
Subscribe to:
Posts (Atom)